
Advertisement
- India
- /
- Construction
- /
- NSEI:RPPINFRA
Slammed 27% R.P.P. Infra Projects Limited (NSE:RPPINFRA) Screens Well Here But There Might Be A Catch
R.P.P. Infra Projects Limited (NSE:RPPINFRA) shares have retraced a considerable 27% in the last month, reversing a fair amount of their solid recent performance. The good news is that in the last year, the stock has shone bright like a diamond, gaining 174%.
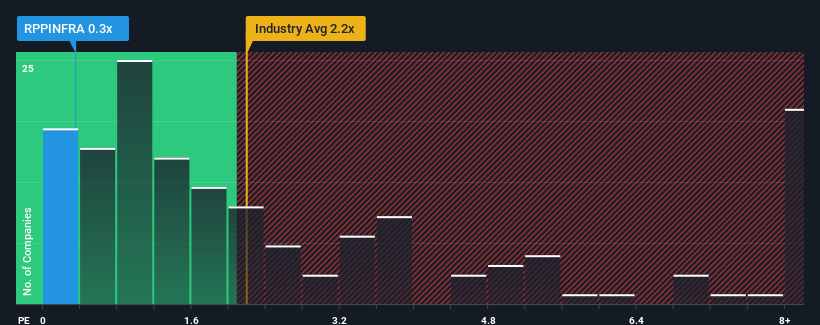
After such a large drop in price, R.P.P. Infra Projects may be sending buy signals at present with its price-to-sales (or "P/S") ratio of 0.3x, considering almost half of all companies in the Construction industry in India have P/S ratios greater than 2.2x and even P/S higher than 6x aren't out of the ordinary. However, the P/S might be low for a reason and it requires further investigation to determine if it's justified.
View our latest analysis for R.P.P. Infra Projects
What Does R.P.P. Infra Projects' P/S Mean For Shareholders?
Revenue has risen firmly for R.P.P. Infra Projects recently, which is pleasing to see. It might be that many expect the respectable revenue performance to degrade substantially, which has repressed the P/S. If you like the company, you'd be hoping this isn't the case so that you could potentially pick up some stock while it's out of favour.
Although there are no analyst estimates available for R.P.P. Infra Projects, take a look at this free data-rich visualisation to see how the company stacks up on earnings, revenue and cash flow.Do Revenue Forecasts Match The Low P/S Ratio?
R.P.P. Infra Projects' P/S ratio would be typical for a company that's only expected to deliver limited growth, and importantly, perform worse than the industry.
Retrospectively, the last year delivered an exceptional 23% gain to the company's top line. The latest three year period has also seen an excellent 159% overall rise in revenue, aided by its short-term performance. Accordingly, shareholders would have definitely welcomed those medium-term rates of revenue growth.
This is in contrast to the rest of the industry, which is expected to grow by 12% over the next year, materially lower than the company's recent medium-term annualised growth rates.
With this information, we find it odd that R.P.P. Infra Projects is trading at a P/S lower than the industry. Apparently some shareholders believe the recent performance has exceeded its limits and have been accepting significantly lower selling prices.
What We Can Learn From R.P.P. Infra Projects' P/S?
R.P.P. Infra Projects' P/S has taken a dip along with its share price. While the price-to-sales ratio shouldn't be the defining factor in whether you buy a stock or not, it's quite a capable barometer of revenue expectations.
We're very surprised to see R.P.P. Infra Projects currently trading on a much lower than expected P/S since its recent three-year growth is higher than the wider industry forecast. When we see robust revenue growth that outpaces the industry, we presume that there are notable underlying risks to the company's future performance, which is exerting downward pressure on the P/S ratio. At least price risks look to be very low if recent medium-term revenue trends continue, but investors seem to think future revenue could see a lot of volatility.
Before you take the next step, you should know about the 2 warning signs for R.P.P. Infra Projects that we have uncovered.
If companies with solid past earnings growth is up your alley, you may wish to see this free collection of other companies with strong earnings growth and low P/E ratios.
New: AI Stock Screener & Alerts
Our new AI Stock Screener scans the market every day to uncover opportunities.
• Dividend Powerhouses (3%+ Yield)
• Undervalued Small Caps with Insider Buying
• High growth Tech and AI Companies
Or build your own from over 50 metrics.
Have feedback on this article? Concerned about the content? Get in touch with us directly. Alternatively, email editorial-team (at) simplywallst.com.
This article by Simply Wall St is general in nature. We provide commentary based on historical data and analyst forecasts only using an unbiased methodology and our articles are not intended to be financial advice. It does not constitute a recommendation to buy or sell any stock, and does not take account of your objectives, or your financial situation. We aim to bring you long-term focused analysis driven by fundamental data. Note that our analysis may not factor in the latest price-sensitive company announcements or qualitative material. Simply Wall St has no position in any stocks mentioned.
About NSEI:RPPINFRA
R.P.P. Infra Projects
Engages in the construction and infrastructure development activities in India and internationally.
Excellent balance sheet with slight risk.
Similar Companies
Market Insights

Advertisement
Weekly Picks
RO


RockeTeller on Santacruz Silver Mining ·
Crazy Undervalued 42 Baggers Silver Play (Active & Running Mine)
Fair Value:CA$8696.7% undervalued
32 followersusers have followed this narrative
6 commentsusers have commented on this narrative
9 likesusers have liked this narrative
RO


Robbo on Fiducian Group ·
Fiducian: Compliance Clouds or Value Opportunity?
Fair Value:AU$126.1% undervalued
4 followersusers have followed this narrative
0 commentsusers have commented on this narrative
0 likesusers have liked this narrative
WO

woodworthfund on Willamette Valley Vineyards ·
Willamette Valley Vineyards (WVVI): Not-So-Great Value
Fair Value:US$242.5% overvalued
6 followersusers have followed this narrative
0 commentsusers have commented on this narrative
1 likeusers have liked this narrative
Recently Updated Narratives
MA


MarkoVT on Alphabet ·
Positioned globally, partnered locally
Fair Value:US$390.1919.1% undervalued
1 followerusers have followed this narrative
0 commentsusers have commented on this narrative
0 likesusers have liked this narrative
JO


JohnJ on Worldline ·
When will fraudsters be investigated in depth. Fraud was ongoing in France too.
Fair Value:€0.5190.0% overvalued
1 followerusers have followed this narrative
0 commentsusers have commented on this narrative
0 likesusers have liked this narrative
MA

MarkoVT on Applied Digital ·
Staggered by dilution; positions for growth
Fair Value:US$35.4520.9% undervalued
5 followersusers have followed this narrative
0 commentsusers have commented on this narrative
0 likesusers have liked this narrative
Popular Narratives
TH


TheWallstreetKing on MicroVision ·
MicroVision will explode future revenue by 380.37% with a vision towards success
Fair Value:US$6098.6% undervalued
112 followersusers have followed this narrative
11 commentsusers have commented on this narrative
22 likesusers have liked this narrative
AN


AnalystConsensusTarget on NVIDIA ·
NVDA: Expanding AI Demand Will Drive Major Data Center Investments Through 2026
Fair Value:US$250.3927.5% undervalued
951 followersusers have followed this narrative
6 commentsusers have commented on this narrative
25 likesusers have liked this narrative
OS

oscargarcia on Alphabet ·
The company that turned a verb into a global necessity and basically runs the modern internet, digital ads, smartphones, maps, and AI.
Fair Value:US$3407.1% undervalued
148 followersusers have followed this narrative
6 commentsusers have commented on this narrative
18 likesusers have liked this narrative

