- India
- /
- Trade Distributors
- /
- NSEI:PRITIKAUTO
Pritika Auto Industries Limited's (NSE:PRITIKAUTO) 35% Cheaper Price Remains In Tune With Earnings


Pritika Auto Industries Limited (NSE:PRITIKAUTO) shares have had a horrible month, losing 35% after a relatively good period beforehand. Of course, over the longer-term many would still wish they owned shares as the stock's price has soared 106% in the last twelve months.
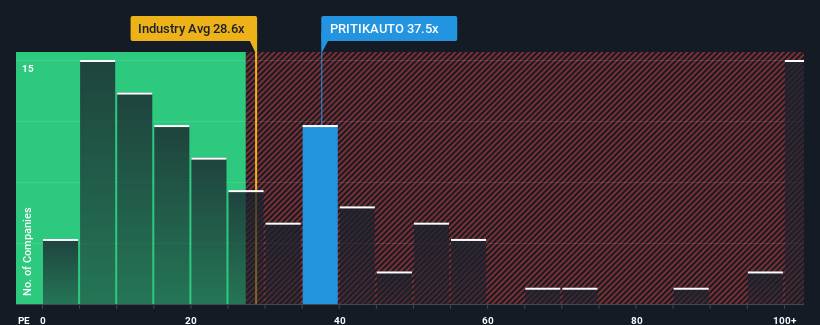
Even after such a large drop in price, Pritika Auto Industries' price-to-earnings (or "P/E") ratio of 37.5x might still make it look like a sell right now compared to the market in India, where around half of the companies have P/E ratios below 28x and even P/E's below 15x are quite common. Although, it's not wise to just take the P/E at face value as there may be an explanation why it's as high as it is.
For instance, Pritika Auto Industries' receding earnings in recent times would have to be some food for thought. One possibility is that the P/E is high because investors think the company will still do enough to outperform the broader market in the near future. You'd really hope so, otherwise you're paying a pretty hefty price for no particular reason.
View our latest analysis for Pritika Auto Industries
What Are Growth Metrics Telling Us About The High P/E?
Pritika Auto Industries' P/E ratio would be typical for a company that's expected to deliver solid growth, and importantly, perform better than the market.
Taking a look back first, the company's earnings per share growth last year wasn't something to get excited about as it posted a disappointing decline of 19%. However, a few very strong years before that means that it was still able to grow EPS by an impressive 165% in total over the last three years. Although it's been a bumpy ride, it's still fair to say the earnings growth recently has been more than adequate for the company.
Comparing that to the market, which is only predicted to deliver 24% growth in the next 12 months, the company's momentum is stronger based on recent medium-term annualised earnings results.
With this information, we can see why Pritika Auto Industries is trading at such a high P/E compared to the market. Presumably shareholders aren't keen to offload something they believe will continue to outmanoeuvre the bourse.
The Key Takeaway
Pritika Auto Industries' P/E hasn't come down all the way after its stock plunged. Typically, we'd caution against reading too much into price-to-earnings ratios when settling on investment decisions, though it can reveal plenty about what other market participants think about the company.
As we suspected, our examination of Pritika Auto Industries revealed its three-year earnings trends are contributing to its high P/E, given they look better than current market expectations. At this stage investors feel the potential for a deterioration in earnings isn't great enough to justify a lower P/E ratio. If recent medium-term earnings trends continue, it's hard to see the share price falling strongly in the near future under these circumstances.
It's always necessary to consider the ever-present spectre of investment risk. We've identified 3 warning signs with Pritika Auto Industries (at least 1 which is significant), and understanding these should be part of your investment process.
Of course, you might also be able to find a better stock than Pritika Auto Industries. So you may wish to see this free collection of other companies that have reasonable P/E ratios and have grown earnings strongly.
New: Manage All Your Stock Portfolios in One Place
We've created the ultimate portfolio companion for stock investors, and it's free.
• Connect an unlimited number of Portfolios and see your total in one currency
• Be alerted to new Warning Signs or Risks via email or mobile
• Track the Fair Value of your stocks
Have feedback on this article? Concerned about the content? Get in touch with us directly. Alternatively, email editorial-team (at) simplywallst.com.
This article by Simply Wall St is general in nature. We provide commentary based on historical data and analyst forecasts only using an unbiased methodology and our articles are not intended to be financial advice. It does not constitute a recommendation to buy or sell any stock, and does not take account of your objectives, or your financial situation. We aim to bring you long-term focused analysis driven by fundamental data. Note that our analysis may not factor in the latest price-sensitive company announcements or qualitative material. Simply Wall St has no position in any stocks mentioned.
About NSEI:PRITIKAUTO
Pritika Auto Industries
Manufactures and sells tractor and automobile components in India.
Solid track record with mediocre balance sheet.
Similar Companies
Market Insights

Community Narratives


