
Advertisement

David Iben put it well when he said, 'Volatility is not a risk we care about. What we care about is avoiding the permanent loss of capital.' So it might be obvious that you need to consider debt, when you think about how risky any given stock is, because too much debt can sink a company. We note that Nava Limited (NSE:NAVA) does have debt on its balance sheet. But should shareholders be worried about its use of debt?
We've discovered 1 warning sign about Nava. View them for free.When Is Debt A Problem?
Debt assists a business until the business has trouble paying it off, either with new capital or with free cash flow. In the worst case scenario, a company can go bankrupt if it cannot pay its creditors. While that is not too common, we often do see indebted companies permanently diluting shareholders because lenders force them to raise capital at a distressed price. By replacing dilution, though, debt can be an extremely good tool for businesses that need capital to invest in growth at high rates of return. When we think about a company's use of debt, we first look at cash and debt together.
What Is Nava's Net Debt?
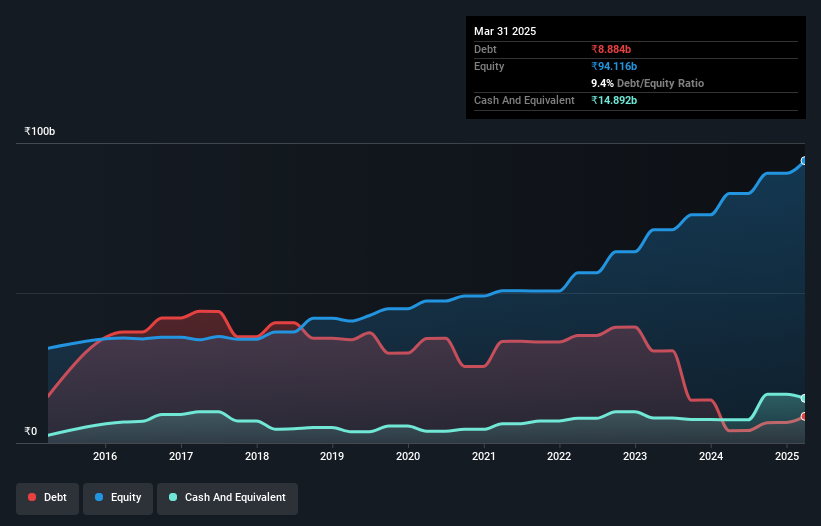
You can click the graphic below for the historical numbers, but it shows that as of March 2025 Nava had ₹8.88b of debt, an increase on ₹4.09b, over one year. However, its balance sheet shows it holds ₹14.9b in cash, so it actually has ₹6.01b net cash.
How Strong Is Nava's Balance Sheet?
According to the last reported balance sheet, Nava had liabilities of ₹6.73b due within 12 months, and liabilities of ₹11.9b due beyond 12 months. Offsetting this, it had ₹14.9b in cash and ₹14.1b in receivables that were due within 12 months. So it can boast ₹10.4b more liquid assets than total liabilities.
This short term liquidity is a sign that Nava could probably pay off its debt with ease, as its balance sheet is far from stretched. Succinctly put, Nava boasts net cash, so it's fair to say it does not have a heavy debt load!
See our latest analysis for Nava
The good news is that Nava has increased its EBIT by 5.5% over twelve months, which should ease any concerns about debt repayment. When analysing debt levels, the balance sheet is the obvious place to start. But you can't view debt in total isolation; since Nava will need earnings to service that debt. So when considering debt, it's definitely worth looking at the earnings trend. Click here for an interactive snapshot.
Finally, a business needs free cash flow to pay off debt; accounting profits just don't cut it. Nava may have net cash on the balance sheet, but it is still interesting to look at how well the business converts its earnings before interest and tax (EBIT) to free cash flow, because that will influence both its need for, and its capacity to manage debt. Over the last three years, Nava actually produced more free cash flow than EBIT. There's nothing better than incoming cash when it comes to staying in your lenders' good graces.
Summing Up
While it is always sensible to investigate a company's debt, in this case Nava has ₹6.01b in net cash and a decent-looking balance sheet. The cherry on top was that in converted 131% of that EBIT to free cash flow, bringing in ₹13b. So is Nava's debt a risk? It doesn't seem so to us. There's no doubt that we learn most about debt from the balance sheet. However, not all investment risk resides within the balance sheet - far from it. To that end, you should be aware of the 1 warning sign we've spotted with Nava .
Of course, if you're the type of investor who prefers buying stocks without the burden of debt, then don't hesitate to discover our exclusive list of net cash growth stocks, today.
Valuation is complex, but we're here to simplify it.
Discover if Nava might be undervalued or overvalued with our detailed analysis, featuring fair value estimates, potential risks, dividends, insider trades, and its financial condition.
Access Free AnalysisHave feedback on this article? Concerned about the content? Get in touch with us directly. Alternatively, email editorial-team (at) simplywallst.com.
This article by Simply Wall St is general in nature. We provide commentary based on historical data and analyst forecasts only using an unbiased methodology and our articles are not intended to be financial advice. It does not constitute a recommendation to buy or sell any stock, and does not take account of your objectives, or your financial situation. We aim to bring you long-term focused analysis driven by fundamental data. Note that our analysis may not factor in the latest price-sensitive company announcements or qualitative material. Simply Wall St has no position in any stocks mentioned.
About NSEI:NAVA
Nava
Engages in the ferro alloys, power, mining, and healthcare businesses in India and internationally.
Flawless balance sheet established dividend payer.
Market Insights

Advertisement
Community Narratives
Pinterest will surge as advertising innovations ignite revenue growth
Fair Value US$42.63|26.3% undervalued
BR
Community Contributor
Brambles' Revenue Set to Climb 14% with Profit Margins Following
Fair Value AU$21.90|4.8% overvalued
RO
Community Contributor
Challenging Future for STG as Organic Sales Decline by 8.8%
Fair Value DKK 116.13|26.8% undervalued
KA
Community Contributor