
Advertisement
- India
- /
- Electrical
- /
- NSEI:KEI
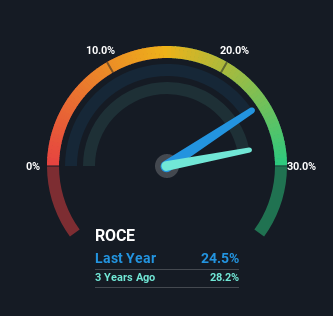
Some Investors May Be Worried About KEI Industries' (NSE:KEI) Returns On Capital

What trends should we look for it we want to identify stocks that can multiply in value over the long term? Firstly, we'll want to see a proven return on capital employed (ROCE) that is increasing, and secondly, an expanding base of capital employed. If you see this, it typically means it's a company with a great business model and plenty of profitable reinvestment opportunities. Looking at KEI Industries (NSE:KEI), it does have a high ROCE right now, but lets see how returns are trending.
Understanding Return On Capital Employed (ROCE)
If you haven't worked with ROCE before, it measures the 'return' (pre-tax profit) a company generates from capital employed in its business. The formula for this calculation on KEI Industries is:
Return on Capital Employed = Earnings Before Interest and Tax (EBIT) ÷ (Total Assets - Current Liabilities)
0.24 = ₹6.5b ÷ (₹38b - ₹11b) (Based on the trailing twelve months to March 2023).
Thus, KEI Industries has an ROCE of 24%. That's a fantastic return and not only that, it outpaces the average of 15% earned by companies in a similar industry.
See our latest analysis for KEI Industries
In the above chart we have measured KEI Industries' prior ROCE against its prior performance, but the future is arguably more important. If you'd like, you can check out the forecasts from the analysts covering KEI Industries here for free.
SWOT Analysis for KEI Industries
Strength
- Earnings growth over the past year exceeded its 5-year average.
- Debt is not viewed as a risk.
Weakness
- Earnings growth over the past year underperformed the Electrical industry.
- Dividend is low compared to the top 25% of dividend payers in the Electrical market.
- Expensive based on P/E ratio and estimated fair value.
Opportunity
- Annual earnings are forecast to grow faster than the Indian market.
Threat
- Revenue is forecast to grow slower than 20% per year.
So How Is KEI Industries' ROCE Trending?
In terms of KEI Industries' historical ROCE movements, the trend isn't fantastic. To be more specific, while the ROCE is still high, it's fallen from 39% where it was five years ago. However, given capital employed and revenue have both increased it appears that the business is currently pursuing growth, at the consequence of short term returns. And if the increased capital generates additional returns, the business, and thus shareholders, will benefit in the long run.
On a side note, KEI Industries has done well to pay down its current liabilities to 30% of total assets. That could partly explain why the ROCE has dropped. Effectively this means their suppliers or short-term creditors are funding less of the business, which reduces some elements of risk. Some would claim this reduces the business' efficiency at generating ROCE since it is now funding more of the operations with its own money.
What We Can Learn From KEI Industries' ROCE
Even though returns on capital have fallen in the short term, we find it promising that revenue and capital employed have both increased for KEI Industries. And long term investors must be optimistic going forward because the stock has returned a huge 387% to shareholders in the last five years. So while the underlying trends could already be accounted for by investors, we still think this stock is worth looking into further.
On a final note, we've found 1 warning sign for KEI Industries that we think you should be aware of.
If you'd like to see other companies earning high returns, check out our free list of companies earning high returns with solid balance sheets here.
Valuation is complex, but we're here to simplify it.
Discover if KEI Industries might be undervalued or overvalued with our detailed analysis, featuring fair value estimates, potential risks, dividends, insider trades, and its financial condition.
Access Free AnalysisHave feedback on this article? Concerned about the content? Get in touch with us directly. Alternatively, email editorial-team (at) simplywallst.com.
This article by Simply Wall St is general in nature. We provide commentary based on historical data and analyst forecasts only using an unbiased methodology and our articles are not intended to be financial advice. It does not constitute a recommendation to buy or sell any stock, and does not take account of your objectives, or your financial situation. We aim to bring you long-term focused analysis driven by fundamental data. Note that our analysis may not factor in the latest price-sensitive company announcements or qualitative material. Simply Wall St has no position in any stocks mentioned.
About NSEI:KEI
KEI Industries
Manufactures, sells, and markets wires and cables in India and internationally.
Excellent balance sheet with limited growth.
Similar Companies
Market Insights

Advertisement
Community Narratives

Apple: A Dying Star with an Overpriced Valuation
Fair Value US$177.34|19.1% overvalued
IN
Community Contributor
Avino a case for USD$20 per share within 5 years (assuming $3,500 gold, $100 silver and $4 copper).
Fair Value CA$26.79|86.0% undervalued
AG
Community Contributor
Riding the Defense Boom RENK Sees Revenue Climb at 15% CAGR by FY 2029
Fair Value €69.87|14.3% undervalued
CH
Community Contributor