Kabra Extrusiontechnik's (NSE:KABRAEXTRU) five-year earnings growth trails the 44% YoY shareholder returns


It hasn't been the best quarter for Kabra Extrusiontechnik Limited (NSE:KABRAEXTRU) shareholders, since the share price has fallen 29% in that time. But that doesn't undermine the fantastic longer term performance (measured over five years). To be precise, the stock price is 497% higher than it was five years ago, a wonderful performance by any measure. Arguably, the recent fall is to be expected after such a strong rise. Of course what matters most is whether the business can improve itself sustainably, thus justifying a higher price.
After a strong gain in the past week, it's worth seeing if longer term returns have been driven by improving fundamentals.
We've discovered 1 warning sign about Kabra Extrusiontechnik. View them for free.In his essay The Superinvestors of Graham-and-Doddsville Warren Buffett described how share prices do not always rationally reflect the value of a business. One imperfect but simple way to consider how the market perception of a company has shifted is to compare the change in the earnings per share (EPS) with the share price movement.
During five years of share price growth, Kabra Extrusiontechnik achieved compound earnings per share (EPS) growth of 9.9% per year. This EPS growth is slower than the share price growth of 43% per year, over the same period. This suggests that market participants hold the company in higher regard, these days. And that's hardly shocking given the track record of growth.
The image below shows how EPS has tracked over time (if you click on the image you can see greater detail).
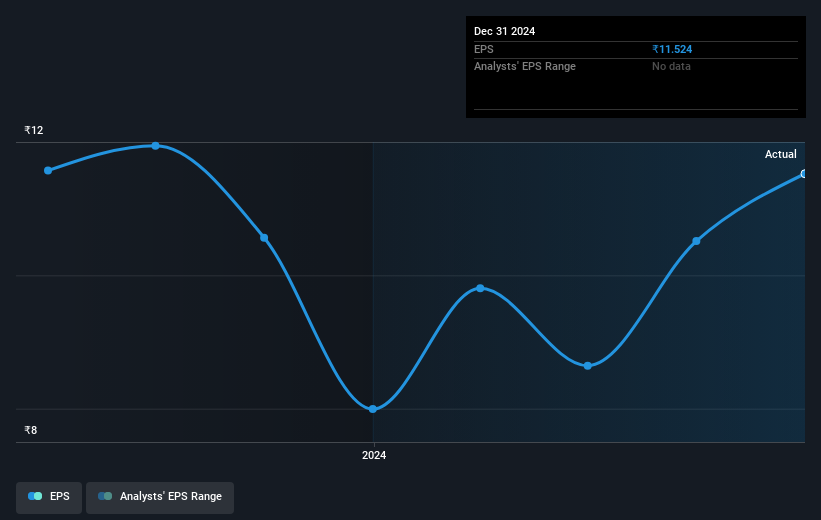
This free interactive report on Kabra Extrusiontechnik's earnings, revenue and cash flow is a great place to start, if you want to investigate the stock further.
What About Dividends?
When looking at investment returns, it is important to consider the difference between total shareholder return (TSR) and share price return. The TSR incorporates the value of any spin-offs or discounted capital raisings, along with any dividends, based on the assumption that the dividends are reinvested. It's fair to say that the TSR gives a more complete picture for stocks that pay a dividend. As it happens, Kabra Extrusiontechnik's TSR for the last 5 years was 518%, which exceeds the share price return mentioned earlier. This is largely a result of its dividend payments!
A Different Perspective
Investors in Kabra Extrusiontechnik had a tough year, with a total loss of 25% (including dividends), against a market gain of about 5.2%. However, keep in mind that even the best stocks will sometimes underperform the market over a twelve month period. On the bright side, long term shareholders have made money, with a gain of 44% per year over half a decade. It could be that the recent sell-off is an opportunity, so it may be worth checking the fundamental data for signs of a long term growth trend. I find it very interesting to look at share price over the long term as a proxy for business performance. But to truly gain insight, we need to consider other information, too. Consider for instance, the ever-present spectre of investment risk. We've identified 1 warning sign with Kabra Extrusiontechnik , and understanding them should be part of your investment process.
Of course, you might find a fantastic investment by looking elsewhere. So take a peek at this free list of companies we expect will grow earnings.
Please note, the market returns quoted in this article reflect the market weighted average returns of stocks that currently trade on Indian exchanges.
Valuation is complex, but we're here to simplify it.
Discover if Kabra Extrusiontechnik might be undervalued or overvalued with our detailed analysis, featuring fair value estimates, potential risks, dividends, insider trades, and its financial condition.
Access Free AnalysisHave feedback on this article? Concerned about the content? Get in touch with us directly. Alternatively, email editorial-team (at) simplywallst.com.
This article by Simply Wall St is general in nature. We provide commentary based on historical data and analyst forecasts only using an unbiased methodology and our articles are not intended to be financial advice. It does not constitute a recommendation to buy or sell any stock, and does not take account of your objectives, or your financial situation. We aim to bring you long-term focused analysis driven by fundamental data. Note that our analysis may not factor in the latest price-sensitive company announcements or qualitative material. Simply Wall St has no position in any stocks mentioned.
About NSEI:KABRAEXTRU
Kabra Extrusiontechnik
Provides plastic extrusion machinery for manufacturing pipes and films in India.
Solid track record with excellent balance sheet.
Similar Companies
Market Insights

Community Narratives


