- India
- /
- Trade Distributors
- /
- NSEI:EXCEL
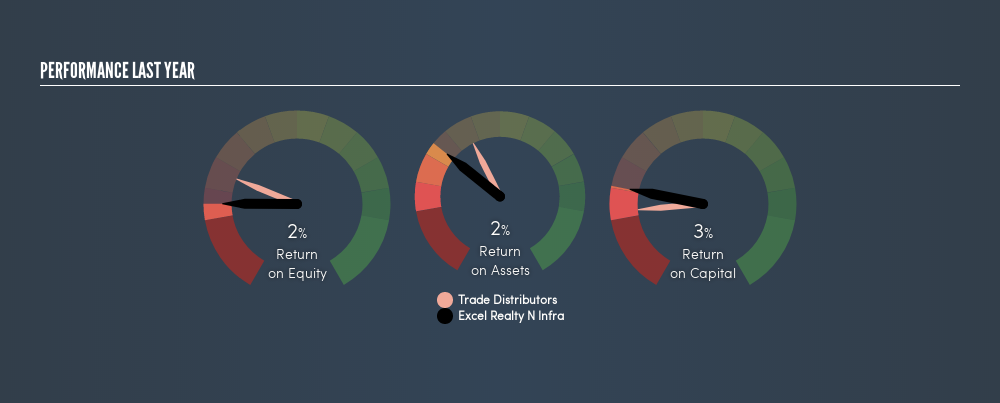
Why We’re Not Keen On Excel Realty N Infra Limited’s (NSE:EXCEL) 2.6% Return On Capital


Today we'll evaluate Excel Realty N Infra Limited (NSE:EXCEL) to determine whether it could have potential as an investment idea. In particular, we'll consider its Return On Capital Employed (ROCE), as that can give us insight into how profitably the company is able to employ capital in its business.
First, we'll go over how we calculate ROCE. Second, we'll look at its ROCE compared to similar companies. Finally, we'll look at how its current liabilities affect its ROCE.
Return On Capital Employed (ROCE): What is it?
ROCE is a metric for evaluating how much pre-tax income (in percentage terms) a company earns on the capital invested in its business. Generally speaking a higher ROCE is better. Overall, it is a valuable metric that has its flaws. Renowned investment researcher Michael Mauboussin has suggested that a high ROCE can indicate that 'one dollar invested in the company generates value of more than one dollar'.
How Do You Calculate Return On Capital Employed?
Analysts use this formula to calculate return on capital employed:
Return on Capital Employed = Earnings Before Interest and Tax (EBIT) ÷ (Total Assets - Current Liabilities)
Or for Excel Realty N Infra:
0.026 = ₹44m ÷ (₹1.8b - ₹34m) (Based on the trailing twelve months to March 2018.)
Therefore, Excel Realty N Infra has an ROCE of 2.6%.
Check out our latest analysis for Excel Realty N Infra
Does Excel Realty N Infra Have A Good ROCE?
ROCE can be useful when making comparisons, such as between similar companies. In this analysis, Excel Realty N Infra's ROCE appears meaningfully below the 6.0% average reported by the Trade Distributors industry. This could be seen as a negative, as it suggests some competitors may be employing their capital more efficiently. Putting aside Excel Realty N Infra's performance relative to its industry, its ROCE in absolute terms is poor - considering the risk of owning stocks compared to government bonds. It is likely that there are more attractive prospects out there.
Our data shows that Excel Realty N Infra currently has an ROCE of 2.6%, compared to its ROCE of 0.6% 3 years ago. This makes us think the business might be improving.
When considering this metric, keep in mind that it is backwards looking, and not necessarily predictive. ROCE can be misleading for companies in cyclical industries, with returns looking impressive during the boom times, but very weak during the busts. ROCE is only a point-in-time measure. How cyclical is Excel Realty N Infra? You can see for yourself by looking at this freegraph of past earnings, revenue and cash flow.
How Excel Realty N Infra's Current Liabilities Impact Its ROCE
Liabilities, such as supplier bills and bank overdrafts, are referred to as current liabilities if they need to be paid within 12 months. Due to the way the ROCE equation works, having large bills due in the near term can make it look as though a company has less capital employed, and thus a higher ROCE than usual. To check the impact of this, we calculate if a company has high current liabilities relative to its total assets.
Excel Realty N Infra has total assets of ₹1.8b and current liabilities of ₹34m. Therefore its current liabilities are equivalent to approximately 1.9% of its total assets. Excel Realty N Infra has a low level of current liabilities, which have a negligible impact on its already low ROCE.
The Bottom Line On Excel Realty N Infra's ROCE
Still, investors could probably find more attractive prospects with better performance out there. Of course you might be able to find a better stock than Excel Realty N Infra. So you may wish to see this freecollection of other companies that have grown earnings strongly.
If you like to buy stocks alongside management, then you might just love this freelist of companies. (Hint: insiders have been buying them).
We aim to bring you long-term focused research analysis driven by fundamental data. Note that our analysis may not factor in the latest price-sensitive company announcements or qualitative material.
If you spot an error that warrants correction, please contact the editor at editorial-team@simplywallst.com. This article by Simply Wall St is general in nature. It does not constitute a recommendation to buy or sell any stock, and does not take account of your objectives, or your financial situation. Simply Wall St has no position in the stocks mentioned. Thank you for reading.
About NSEI:EXCEL
Excel Realty N Infra
Engages in the infrastructure, information technology, business process outsourcing, and general trading activities in India.
Adequate balance sheet low.
Market Insights

Community Narratives


