
Advertisement
- India
- /
- Electrical
- /
- NSEI:DENORA
De Nora India Limited's (NSE:DENORA) Fundamentals Look Pretty Strong: Could The Market Be Wrong About The Stock?

It is hard to get excited after looking at De Nora India's (NSE:DENORA) recent performance, when its stock has declined 23% over the past three months. However, stock prices are usually driven by a company’s financials over the long term, which in this case look pretty respectable. Particularly, we will be paying attention to De Nora India's ROE today.
ROE or return on equity is a useful tool to assess how effectively a company can generate returns on the investment it received from its shareholders. In simpler terms, it measures the profitability of a company in relation to shareholder's equity.
View our latest analysis for De Nora India
How Is ROE Calculated?
The formula for ROE is:
Return on Equity = Net Profit (from continuing operations) ÷ Shareholders' Equity
So, based on the above formula, the ROE for De Nora India is:
15% = ₹183m ÷ ₹1.2b (Based on the trailing twelve months to September 2024).
The 'return' is the profit over the last twelve months. That means that for every ₹1 worth of shareholders' equity, the company generated ₹0.15 in profit.
What Has ROE Got To Do With Earnings Growth?
So far, we've learned that ROE is a measure of a company's profitability. We now need to evaluate how much profit the company reinvests or "retains" for future growth which then gives us an idea about the growth potential of the company. Assuming everything else remains unchanged, the higher the ROE and profit retention, the higher the growth rate of a company compared to companies that don't necessarily bear these characteristics.
De Nora India's Earnings Growth And 15% ROE
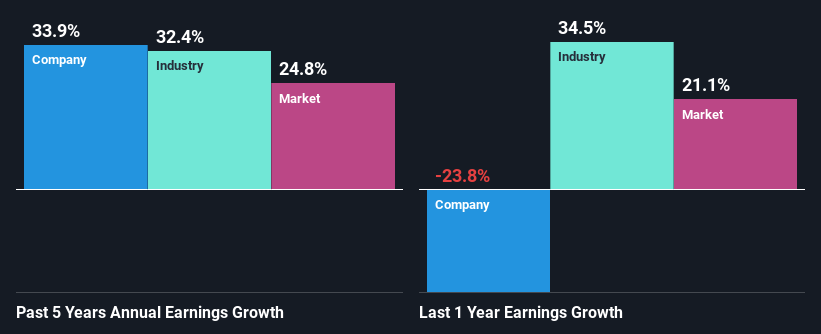
At first glance, De Nora India's ROE doesn't look very promising. Yet, a closer study shows that the company's ROE is similar to the industry average of 13%. Moreover, we are quite pleased to see that De Nora India's net income grew significantly at a rate of 34% over the last five years. Given the slightly low ROE, it is likely that there could be some other aspects that are driving this growth. Such as - high earnings retention or an efficient management in place.
As a next step, we compared De Nora India's net income growth with the industry and found that the company has a similar growth figure when compared with the industry average growth rate of 32% in the same period.
The basis for attaching value to a company is, to a great extent, tied to its earnings growth. The investor should try to establish if the expected growth or decline in earnings, whichever the case may be, is priced in. This then helps them determine if the stock is placed for a bright or bleak future. Is De Nora India fairly valued compared to other companies? These 3 valuation measures might help you decide.
Is De Nora India Efficiently Re-investing Its Profits?
De Nora India's ' three-year median payout ratio is on the lower side at 5.2% implying that it is retaining a higher percentage (95%) of its profits. This suggests that the management is reinvesting most of the profits to grow the business as evidenced by the growth seen by the company.
Additionally, De Nora India has paid dividends over a period of at least ten years which means that the company is pretty serious about sharing its profits with shareholders.
Summary
In total, it does look like De Nora India has some positive aspects to its business. Even in spite of the low rate of return, the company has posted impressive earnings growth as a result of reinvesting heavily into its business. While we won't completely dismiss the company, what we would do, is try to ascertain how risky the business is to make a more informed decision around the company. Our risks dashboard will have the 1 risk we have identified for De Nora India.
New: Manage All Your Stock Portfolios in One Place
We've created the ultimate portfolio companion for stock investors, and it's free.
• Connect an unlimited number of Portfolios and see your total in one currency
• Be alerted to new Warning Signs or Risks via email or mobile
• Track the Fair Value of your stocks
Have feedback on this article? Concerned about the content? Get in touch with us directly. Alternatively, email editorial-team (at) simplywallst.com.
This article by Simply Wall St is general in nature. We provide commentary based on historical data and analyst forecasts only using an unbiased methodology and our articles are not intended to be financial advice. It does not constitute a recommendation to buy or sell any stock, and does not take account of your objectives, or your financial situation. We aim to bring you long-term focused analysis driven by fundamental data. Note that our analysis may not factor in the latest price-sensitive company announcements or qualitative material. Simply Wall St has no position in any stocks mentioned.
About NSEI:DENORA
De Nora India
Manufactures, sells, and services electrolytic products in India and internationally.
Flawless balance sheet with questionable track record.
Market Insights

Advertisement
Community Narratives

Apple: A Dying Star with an Overpriced Valuation
Fair Value US$177.34|19.1% overvalued
IN
Community Contributor
Avino a case for USD$20 per share within 5 years (assuming $3,500 gold, $100 silver and $4 copper).
Fair Value CA$26.79|86.0% undervalued
AG
Community Contributor
Riding the Defense Boom RENK Sees Revenue Climb at 15% CAGR by FY 2029
Fair Value €69.87|14.3% undervalued
CH
Community Contributor