- India
- /
- Aerospace & Defense
- /
- NSEI:DATAPATTNS
What You Can Learn From Data Patterns (India) Limited's (NSE:DATAPATTNS) P/E After Its 27% Share Price Crash

Data Patterns (India) Limited (NSE:DATAPATTNS) shareholders that were waiting for something to happen have been dealt a blow with a 27% share price drop in the last month. Instead of being rewarded, shareholders who have already held through the last twelve months are now sitting on a 20% share price drop.
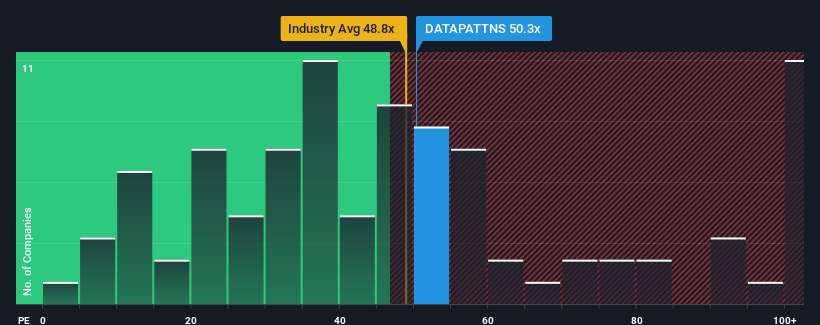
Even after such a large drop in price, given close to half the companies in India have price-to-earnings ratios (or "P/E's") below 26x, you may still consider Data Patterns (India) as a stock to avoid entirely with its 50.3x P/E ratio. Nonetheless, we'd need to dig a little deeper to determine if there is a rational basis for the highly elevated P/E.
With earnings growth that's inferior to most other companies of late, Data Patterns (India) has been relatively sluggish. It might be that many expect the uninspiring earnings performance to recover significantly, which has kept the P/E from collapsing. You'd really hope so, otherwise you're paying a pretty hefty price for no particular reason.
See our latest analysis for Data Patterns (India)
How Is Data Patterns (India)'s Growth Trending?
In order to justify its P/E ratio, Data Patterns (India) would need to produce outstanding growth well in excess of the market.
Retrospectively, the last year delivered a decent 6.2% gain to the company's bottom line. Pleasingly, EPS has also lifted 53% in aggregate from three years ago, partly thanks to the last 12 months of growth. So we can start by confirming that the company has done a great job of growing earnings over that time.
Turning to the outlook, the next year should generate growth of 43% as estimated by the six analysts watching the company. With the market only predicted to deliver 26%, the company is positioned for a stronger earnings result.
With this information, we can see why Data Patterns (India) is trading at such a high P/E compared to the market. It seems most investors are expecting this strong future growth and are willing to pay more for the stock.
The Final Word
Even after such a strong price drop, Data Patterns (India)'s P/E still exceeds the rest of the market significantly. Typically, we'd caution against reading too much into price-to-earnings ratios when settling on investment decisions, though it can reveal plenty about what other market participants think about the company.
As we suspected, our examination of Data Patterns (India)'s analyst forecasts revealed that its superior earnings outlook is contributing to its high P/E. Right now shareholders are comfortable with the P/E as they are quite confident future earnings aren't under threat. It's hard to see the share price falling strongly in the near future under these circumstances.
Having said that, be aware Data Patterns (India) is showing 1 warning sign in our investment analysis, you should know about.
Of course, you might also be able to find a better stock than Data Patterns (India). So you may wish to see this free collection of other companies that have reasonable P/E ratios and have grown earnings strongly.
Mobile Infrastructure for Defense and Disaster
The next wave in robotics isn't humanoid. Its fully autonomous towers delivering 5G, ISR, and radar in under 30 minutes, anywhere.
Get the investor briefing before the next round of contracts
Sponsored On Behalf of CiTechNew: Manage All Your Stock Portfolios in One Place
We've created the ultimate portfolio companion for stock investors, and it's free.
• Connect an unlimited number of Portfolios and see your total in one currency
• Be alerted to new Warning Signs or Risks via email or mobile
• Track the Fair Value of your stocks
Have feedback on this article? Concerned about the content? Get in touch with us directly. Alternatively, email editorial-team (at) simplywallst.com.
This article by Simply Wall St is general in nature. We provide commentary based on historical data and analyst forecasts only using an unbiased methodology and our articles are not intended to be financial advice. It does not constitute a recommendation to buy or sell any stock, and does not take account of your objectives, or your financial situation. We aim to bring you long-term focused analysis driven by fundamental data. Note that our analysis may not factor in the latest price-sensitive company announcements or qualitative material. Simply Wall St has no position in any stocks mentioned.
About NSEI:DATAPATTNS
Data Patterns (India)
Provides defense and aerospace electronics solutions in India.
Flawless balance sheet with reasonable growth potential.
Similar Companies
Market Insights

Weekly Picks

THE KINGDOM OF BROWN GOODS: WHY MGPI IS BEING CRUSHED BY INVENTORY & PRIMED FOR RESURRECTION


Why Vertical Aerospace (NYSE: EVTL) is Worth Possibly Over 13x its Current Price


The Quiet Giant That Became AI’s Power Grid
Recently Updated Narratives

Deep Value Multi Bagger Opportunity


A case for CA$31.80 (undiluted), aka 8,616% upside from CA$0.37 (an 86 bagger!).


Unicycive Therapeutics (Nasdaq: UNCY) – Preparing for a Second Shot at Bringing a New Kidney Treatment to Market (TEST)
Popular Narratives


MicroVision will explode future revenue by 380.37% with a vision towards success


NVDA: Expanding AI Demand Will Drive Major Data Center Investments Through 2026


Crazy Undervalued 42 Baggers Silver Play (Active & Running Mine)
Trending Discussion

