
Advertisement
- India
- /
- Aerospace & Defense
- /
- NSEI:DATAPATTNS
Data Patterns (India) Limited (NSE:DATAPATTNS) Stocks Shoot Up 33% But Its P/S Still Looks Reasonable
Data Patterns (India) Limited (NSE:DATAPATTNS) shareholders would be excited to see that the share price has had a great month, posting a 33% gain and recovering from prior weakness. The last 30 days bring the annual gain to a very sharp 78%.
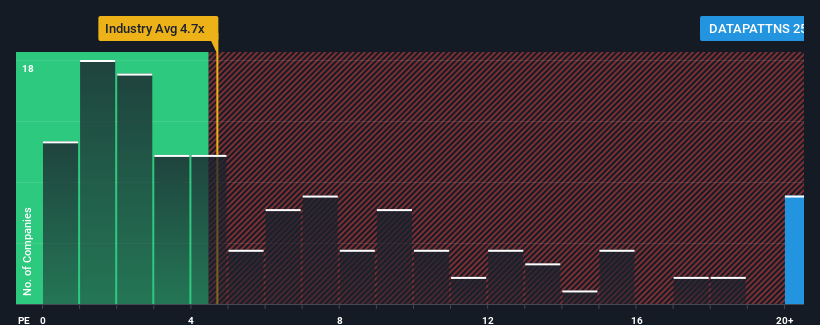
Following the firm bounce in price, given around half the companies in India's Aerospace & Defense industry have price-to-sales ratios (or "P/S") below 7.4x, you may consider Data Patterns (India) as a stock to avoid entirely with its 25.5x P/S ratio. Although, it's not wise to just take the P/S at face value as there may be an explanation why it's so lofty.
See our latest analysis for Data Patterns (India)
What Does Data Patterns (India)'s Recent Performance Look Like?
Recent times have been advantageous for Data Patterns (India) as its revenues have been rising faster than most other companies. It seems the market expects this form will continue into the future, hence the elevated P/S ratio. You'd really hope so, otherwise you're paying a pretty hefty price for no particular reason.
Want the full picture on analyst estimates for the company? Then our free report on Data Patterns (India) will help you uncover what's on the horizon.What Are Revenue Growth Metrics Telling Us About The High P/S?
The only time you'd be truly comfortable seeing a P/S as steep as Data Patterns (India)'s is when the company's growth is on track to outshine the industry decidedly.
Retrospectively, the last year delivered an exceptional 19% gain to the company's top line. Pleasingly, revenue has also lifted 133% in aggregate from three years ago, thanks to the last 12 months of growth. Accordingly, shareholders would have definitely welcomed those medium-term rates of revenue growth.
Turning to the outlook, the next year should generate growth of 36% as estimated by the five analysts watching the company. With the industry only predicted to deliver 26%, the company is positioned for a stronger revenue result.
With this in mind, it's not hard to understand why Data Patterns (India)'s P/S is high relative to its industry peers. It seems most investors are expecting this strong future growth and are willing to pay more for the stock.
What We Can Learn From Data Patterns (India)'s P/S?
Data Patterns (India)'s P/S has grown nicely over the last month thanks to a handy boost in the share price. While the price-to-sales ratio shouldn't be the defining factor in whether you buy a stock or not, it's quite a capable barometer of revenue expectations.
As we suspected, our examination of Data Patterns (India)'s analyst forecasts revealed that its superior revenue outlook is contributing to its high P/S. At this stage investors feel the potential for a deterioration in revenues is quite remote, justifying the elevated P/S ratio. Unless the analysts have really missed the mark, these strong revenue forecasts should keep the share price buoyant.
Many other vital risk factors can be found on the company's balance sheet. Our free balance sheet analysis for Data Patterns (India) with six simple checks will allow you to discover any risks that could be an issue.
If you're unsure about the strength of Data Patterns (India)'s business, why not explore our interactive list of stocks with solid business fundamentals for some other companies you may have missed.
New: Manage All Your Stock Portfolios in One Place
We've created the ultimate portfolio companion for stock investors, and it's free.
• Connect an unlimited number of Portfolios and see your total in one currency
• Be alerted to new Warning Signs or Risks via email or mobile
• Track the Fair Value of your stocks
Have feedback on this article? Concerned about the content? Get in touch with us directly. Alternatively, email editorial-team (at) simplywallst.com.
This article by Simply Wall St is general in nature. We provide commentary based on historical data and analyst forecasts only using an unbiased methodology and our articles are not intended to be financial advice. It does not constitute a recommendation to buy or sell any stock, and does not take account of your objectives, or your financial situation. We aim to bring you long-term focused analysis driven by fundamental data. Note that our analysis may not factor in the latest price-sensitive company announcements or qualitative material. Simply Wall St has no position in any stocks mentioned.
About NSEI:DATAPATTNS
Data Patterns (India)
Provides defense and aerospace electronics solutions in India.
High growth potential with excellent balance sheet.
Similar Companies
Market Insights

Advertisement
Community Narratives
A formidable player in AI and enterprise computing.
Fair Value US$210.00|3.1% overvalued
CO
Community Contributor
IREN's Bold Moves in Sustainable Bitcoin Mining & AI Data Centers
Fair Value US$72.52|11.6% undervalued
BL
Community Contributor
Cooling the Champions: The Aussie Tech Behind F1's Victories
Fair Value AU$12.40|40.4% undervalued
TR
Community Contributor