Returns On Capital At Blue Star (NSE:BLUESTARCO) Paint A Concerning Picture


Did you know there are some financial metrics that can provide clues of a potential multi-bagger? One common approach is to try and find a company with returns on capital employed (ROCE) that are increasing, in conjunction with a growing amount of capital employed. Put simply, these types of businesses are compounding machines, meaning they are continually reinvesting their earnings at ever-higher rates of return. So when we looked at Blue Star (NSE:BLUESTARCO), they do have a high ROCE, but we weren't exactly elated from how returns are trending.
What Is Return On Capital Employed (ROCE)?
Just to clarify if you're unsure, ROCE is a metric for evaluating how much pre-tax income (in percentage terms) a company earns on the capital invested in its business. Analysts use this formula to calculate it for Blue Star:
Return on Capital Employed = Earnings Before Interest and Tax (EBIT) ÷ (Total Assets - Current Liabilities)
0.24 = ₹6.5b ÷ (₹66b - ₹39b) (Based on the trailing twelve months to June 2024).
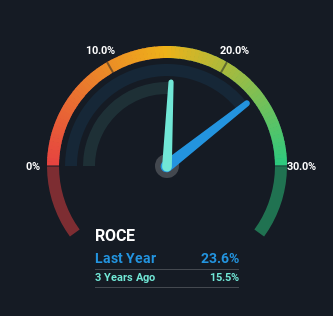
Therefore, Blue Star has an ROCE of 24%. In absolute terms that's a great return and it's even better than the Building industry average of 18%.
Check out our latest analysis for Blue Star
In the above chart we have measured Blue Star's prior ROCE against its prior performance, but the future is arguably more important. If you'd like, you can check out the forecasts from the analysts covering Blue Star for free.
So How Is Blue Star's ROCE Trending?
When we looked at the ROCE trend at Blue Star, we didn't gain much confidence. Historically returns on capital were even higher at 31%, but they have dropped over the last five years. Although, given both revenue and the amount of assets employed in the business have increased, it could suggest the company is investing in growth, and the extra capital has led to a short-term reduction in ROCE. And if the increased capital generates additional returns, the business, and thus shareholders, will benefit in the long run.
On a related note, Blue Star has decreased its current liabilities to 59% of total assets. So we could link some of this to the decrease in ROCE. What's more, this can reduce some aspects of risk to the business because now the company's suppliers or short-term creditors are funding less of its operations. Some would claim this reduces the business' efficiency at generating ROCE since it is now funding more of the operations with its own money. Keep in mind 59% is still pretty high, so those risks are still somewhat prevalent.
The Key Takeaway
Even though returns on capital have fallen in the short term, we find it promising that revenue and capital employed have both increased for Blue Star. And the stock has done incredibly well with a 423% return over the last five years, so long term investors are no doubt ecstatic with that result. So while the underlying trends could already be accounted for by investors, we still think this stock is worth looking into further.
On a final note, we've found 2 warning signs for Blue Star that we think you should be aware of.
Blue Star is not the only stock earning high returns. If you'd like to see more, check out our free list of companies earning high returns on equity with solid fundamentals.
If you're looking to trade Blue Star, open an account with the lowest-cost platform trusted by professionals, Interactive Brokers.
With clients in over 200 countries and territories, and access to 160 markets, IBKR lets you trade stocks, options, futures, forex, bonds and funds from a single integrated account.
Enjoy no hidden fees, no account minimums, and FX conversion rates as low as 0.03%, far better than what most brokers offer.
Sponsored ContentValuation is complex, but we're here to simplify it.
Discover if Blue Star might be undervalued or overvalued with our detailed analysis, featuring fair value estimates, potential risks, dividends, insider trades, and its financial condition.
Access Free AnalysisHave feedback on this article? Concerned about the content? Get in touch with us directly. Alternatively, email editorial-team (at) simplywallst.com.
This article by Simply Wall St is general in nature. We provide commentary based on historical data and analyst forecasts only using an unbiased methodology and our articles are not intended to be financial advice. It does not constitute a recommendation to buy or sell any stock, and does not take account of your objectives, or your financial situation. We aim to bring you long-term focused analysis driven by fundamental data. Note that our analysis may not factor in the latest price-sensitive company announcements or qualitative material. Simply Wall St has no position in any stocks mentioned.
About NSEI:BLUESTARCO
Blue Star
Operates as a heating, ventilation, air conditioning, and commercial refrigeration (HVAC&R) company in India.
Flawless balance sheet with solid track record and pays a dividend.
Similar Companies
Market Insights

Community Narratives


