Blue Star (NSE:BLUESTARCO) Will Be Hoping To Turn Its Returns On Capital Around


If we want to find a stock that could multiply over the long term, what are the underlying trends we should look for? Firstly, we'd want to identify a growing return on capital employed (ROCE) and then alongside that, an ever-increasing base of capital employed. This shows us that it's a compounding machine, able to continually reinvest its earnings back into the business and generate higher returns. In light of that, when we looked at Blue Star (NSE:BLUESTARCO) and its ROCE trend, we weren't exactly thrilled.
What Is Return On Capital Employed (ROCE)?
Just to clarify if you're unsure, ROCE is a metric for evaluating how much pre-tax income (in percentage terms) a company earns on the capital invested in its business. The formula for this calculation on Blue Star is:
Return on Capital Employed = Earnings Before Interest and Tax (EBIT) ÷ (Total Assets - Current Liabilities)
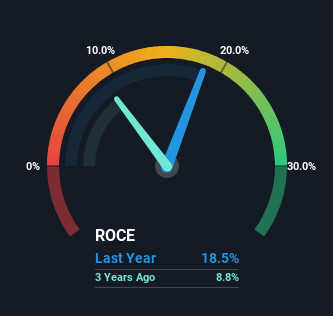
0.18 = ₹4.8b ÷ (₹61b - ₹34b) (Based on the trailing twelve months to September 2023).
Therefore, Blue Star has an ROCE of 18%. That's a pretty standard return and it's in line with the industry average of 18%.
Check out our latest analysis for Blue Star
In the above chart we have measured Blue Star's prior ROCE against its prior performance, but the future is arguably more important. If you'd like to see what analysts are forecasting going forward, you should check out our free report for Blue Star.
What Can We Tell From Blue Star's ROCE Trend?
When we looked at the ROCE trend at Blue Star, we didn't gain much confidence. To be more specific, ROCE has fallen from 30% over the last five years. Although, given both revenue and the amount of assets employed in the business have increased, it could suggest the company is investing in growth, and the extra capital has led to a short-term reduction in ROCE. And if the increased capital generates additional returns, the business, and thus shareholders, will benefit in the long run.
On a side note, Blue Star has done well to pay down its current liabilities to 57% of total assets. That could partly explain why the ROCE has dropped. Effectively this means their suppliers or short-term creditors are funding less of the business, which reduces some elements of risk. Since the business is basically funding more of its operations with it's own money, you could argue this has made the business less efficient at generating ROCE. Either way, they're still at a pretty high level, so we'd like to see them fall further if possible.
The Key Takeaway
In summary, despite lower returns in the short term, we're encouraged to see that Blue Star is reinvesting for growth and has higher sales as a result. And long term investors must be optimistic going forward because the stock has returned a huge 273% to shareholders in the last five years. So while investors seem to be recognizing these promising trends, we would look further into this stock to make sure the other metrics justify the positive view.
Since virtually every company faces some risks, it's worth knowing what they are, and we've spotted 3 warning signs for Blue Star (of which 1 is concerning!) that you should know about.
While Blue Star may not currently earn the highest returns, we've compiled a list of companies that currently earn more than 25% return on equity. Check out this free list here.
If you're looking to trade Blue Star, open an account with the lowest-cost platform trusted by professionals, Interactive Brokers.
With clients in over 200 countries and territories, and access to 160 markets, IBKR lets you trade stocks, options, futures, forex, bonds and funds from a single integrated account.
Enjoy no hidden fees, no account minimums, and FX conversion rates as low as 0.03%, far better than what most brokers offer.
Sponsored ContentValuation is complex, but we're here to simplify it.
Discover if Blue Star might be undervalued or overvalued with our detailed analysis, featuring fair value estimates, potential risks, dividends, insider trades, and its financial condition.
Access Free AnalysisHave feedback on this article? Concerned about the content? Get in touch with us directly. Alternatively, email editorial-team (at) simplywallst.com.
This article by Simply Wall St is general in nature. We provide commentary based on historical data and analyst forecasts only using an unbiased methodology and our articles are not intended to be financial advice. It does not constitute a recommendation to buy or sell any stock, and does not take account of your objectives, or your financial situation. We aim to bring you long-term focused analysis driven by fundamental data. Note that our analysis may not factor in the latest price-sensitive company announcements or qualitative material. Simply Wall St has no position in any stocks mentioned.
About NSEI:BLUESTARCO
Blue Star
Operates as a heating, ventilation, air conditioning, and commercial refrigeration (HVAC&R) company in India.
Flawless balance sheet with solid track record and pays a dividend.
Similar Companies
Market Insights

Community Narratives


