

Did you know there are some financial metrics that can provide clues of a potential multi-bagger? Firstly, we'll want to see a proven return on capital employed (ROCE) that is increasing, and secondly, an expanding base of capital employed. Put simply, these types of businesses are compounding machines, meaning they are continually reinvesting their earnings at ever-higher rates of return. So when we looked at Bhagyanagar India (NSE:BHAGYANGR) and its trend of ROCE, we really liked what we saw.
What Is Return On Capital Employed (ROCE)?
For those who don't know, ROCE is a measure of a company's yearly pre-tax profit (its return), relative to the capital employed in the business. To calculate this metric for Bhagyanagar India, this is the formula:
Return on Capital Employed = Earnings Before Interest and Tax (EBIT) ÷ (Total Assets - Current Liabilities)
0.13 = ₹235m ÷ (₹3.5b - ₹1.7b) (Based on the trailing twelve months to June 2022).
So, Bhagyanagar India has an ROCE of 13%. That's a pretty standard return and it's in line with the industry average of 13%.
Check out the opportunities and risks within the IN Electrical industry.
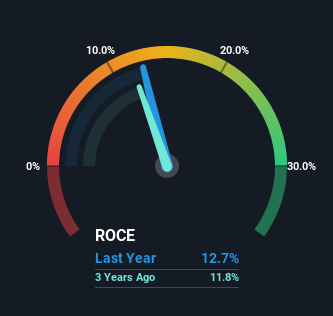
Historical performance is a great place to start when researching a stock so above you can see the gauge for Bhagyanagar India's ROCE against it's prior returns. If you want to delve into the historical earnings, revenue and cash flow of Bhagyanagar India, check out these free graphs here.
What Can We Tell From Bhagyanagar India's ROCE Trend?
We like the trends that we're seeing from Bhagyanagar India. Over the last five years, returns on capital employed have risen substantially to 13%. The amount of capital employed has increased too, by 38%. This can indicate that there's plenty of opportunities to invest capital internally and at ever higher rates, a combination that's common among multi-baggers.
For the record though, there was a noticeable increase in the company's current liabilities over the period, so we would attribute some of the ROCE growth to that. Essentially the business now has suppliers or short-term creditors funding about 47% of its operations, which isn't ideal. And with current liabilities at those levels, that's pretty high.
The Bottom Line On Bhagyanagar India's ROCE
In summary, it's great to see that Bhagyanagar India can compound returns by consistently reinvesting capital at increasing rates of return, because these are some of the key ingredients of those highly sought after multi-baggers. And investors seem to expect more of this going forward, since the stock has rewarded shareholders with a 51% return over the last five years. In light of that, we think it's worth looking further into this stock because if Bhagyanagar India can keep these trends up, it could have a bright future ahead.
If you'd like to know more about Bhagyanagar India, we've spotted 2 warning signs, and 1 of them is significant.
While Bhagyanagar India isn't earning the highest return, check out this free list of companies that are earning high returns on equity with solid balance sheets.
If you're looking to trade Bhagyanagar India, open an account with the lowest-cost platform trusted by professionals, Interactive Brokers.
With clients in over 200 countries and territories, and access to 160 markets, IBKR lets you trade stocks, options, futures, forex, bonds and funds from a single integrated account.
Enjoy no hidden fees, no account minimums, and FX conversion rates as low as 0.03%, far better than what most brokers offer.
Sponsored ContentValuation is complex, but we're here to simplify it.
Discover if Bhagyanagar India might be undervalued or overvalued with our detailed analysis, featuring fair value estimates, potential risks, dividends, insider trades, and its financial condition.
Access Free AnalysisHave feedback on this article? Concerned about the content? Get in touch with us directly. Alternatively, email editorial-team (at) simplywallst.com.
This article by Simply Wall St is general in nature. We provide commentary based on historical data and analyst forecasts only using an unbiased methodology and our articles are not intended to be financial advice. It does not constitute a recommendation to buy or sell any stock, and does not take account of your objectives, or your financial situation. We aim to bring you long-term focused analysis driven by fundamental data. Note that our analysis may not factor in the latest price-sensitive company announcements or qualitative material. Simply Wall St has no position in any stocks mentioned.
About NSEI:BHAGYANGR
Slight and slightly overvalued.
Similar Companies
Market Insights

Community Narratives


