
Advertisement
- India
- /
- Electrical
- /
- NSEI:BHAGYANGR
A Piece Of The Puzzle Missing From Bhagyanagar India Limited's (NSE:BHAGYANGR) 25% Share Price Climb

Bhagyanagar India Limited (NSE:BHAGYANGR) shareholders would be excited to see that the share price has had a great month, posting a 25% gain and recovering from prior weakness. The annual gain comes to 154% following the latest surge, making investors sit up and take notice.
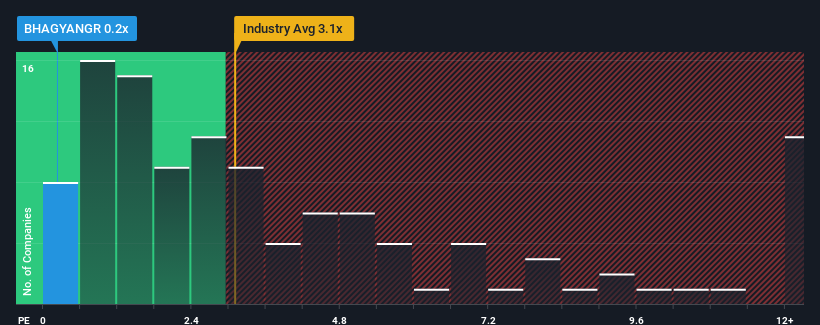
Even after such a large jump in price, Bhagyanagar India's price-to-sales (or "P/S") ratio of 0.2x might still make it look like a strong buy right now compared to the wider Electrical industry in India, where around half of the companies have P/S ratios above 3.1x and even P/S above 6x are quite common. Nonetheless, we'd need to dig a little deeper to determine if there is a rational basis for the highly reduced P/S.
View our latest analysis for Bhagyanagar India
What Does Bhagyanagar India's Recent Performance Look Like?
For example, consider that Bhagyanagar India's financial performance has been poor lately as its revenue has been in decline. One possibility is that the P/S is low because investors think the company won't do enough to avoid underperforming the broader industry in the near future. If you like the company, you'd be hoping this isn't the case so that you could potentially pick up some stock while it's out of favour.
We don't have analyst forecasts, but you can see how recent trends are setting up the company for the future by checking out our free report on Bhagyanagar India's earnings, revenue and cash flow.Do Revenue Forecasts Match The Low P/S Ratio?
There's an inherent assumption that a company should far underperform the industry for P/S ratios like Bhagyanagar India's to be considered reasonable.
In reviewing the last year of financials, we were disheartened to see the company's revenues fell to the tune of 1.2%. However, a few very strong years before that means that it was still able to grow revenue by an impressive 156% in total over the last three years. So we can start by confirming that the company has generally done a very good job of growing revenue over that time, even though it had some hiccups along the way.
This is in contrast to the rest of the industry, which is expected to grow by 30% over the next year, materially lower than the company's recent medium-term annualised growth rates.
In light of this, it's peculiar that Bhagyanagar India's P/S sits below the majority of other companies. Apparently some shareholders believe the recent performance has exceeded its limits and have been accepting significantly lower selling prices.
What Does Bhagyanagar India's P/S Mean For Investors?
Bhagyanagar India's recent share price jump still sees fails to bring its P/S alongside the industry median. Using the price-to-sales ratio alone to determine if you should sell your stock isn't sensible, however it can be a practical guide to the company's future prospects.
We're very surprised to see Bhagyanagar India currently trading on a much lower than expected P/S since its recent three-year growth is higher than the wider industry forecast. Potential investors that are sceptical over continued revenue performance may be preventing the P/S ratio from matching previous strong performance. At least price risks look to be very low if recent medium-term revenue trends continue, but investors seem to think future revenue could see a lot of volatility.
You need to take note of risks, for example - Bhagyanagar India has 4 warning signs (and 2 which are concerning) we think you should know about.
Of course, profitable companies with a history of great earnings growth are generally safer bets. So you may wish to see this free collection of other companies that have reasonable P/E ratios and have grown earnings strongly.
Valuation is complex, but we're here to simplify it.
Discover if Bhagyanagar India might be undervalued or overvalued with our detailed analysis, featuring fair value estimates, potential risks, dividends, insider trades, and its financial condition.
Access Free AnalysisHave feedback on this article? Concerned about the content? Get in touch with us directly. Alternatively, email editorial-team (at) simplywallst.com.
This article by Simply Wall St is general in nature. We provide commentary based on historical data and analyst forecasts only using an unbiased methodology and our articles are not intended to be financial advice. It does not constitute a recommendation to buy or sell any stock, and does not take account of your objectives, or your financial situation. We aim to bring you long-term focused analysis driven by fundamental data. Note that our analysis may not factor in the latest price-sensitive company announcements or qualitative material. Simply Wall St has no position in any stocks mentioned.
About NSEI:BHAGYANGR
Slight and slightly overvalued.
Similar Companies
Market Insights

Advertisement
Community Narratives

Apple: A Dying Star with an Overpriced Valuation
Fair Value US$177.34|19.1% overvalued
IN
Community Contributor
Avino a case for USD$20 per share within 5 years (assuming $3,500 gold, $100 silver and $4 copper).
Fair Value CA$26.79|86.0% undervalued
AG
Community Contributor
Riding the Defense Boom RENK Sees Revenue Climb at 15% CAGR by FY 2029
Fair Value €69.87|14.3% undervalued
CH
Community Contributor