- India
- /
- Electrical
- /
- NSEI:ARE&M
Amara Raja Energy & Mobility (NSE:ARE&M) sheds 5.7% this week, as yearly returns fall more in line with earnings growth


While Amara Raja Energy & Mobility Limited (NSE:ARE&M) shareholders are probably generally happy, the stock hasn't had particularly good run recently, with the share price falling 18% in the last quarter. But that scarcely detracts from the really solid long term returns generated by the company over five years. It's fair to say most would be happy with 118% the gain in that time. To some, the recent pullback wouldn't be surprising after such a fast rise. Only time will tell if there is still too much optimism currently reflected in the share price.
Although Amara Raja Energy & Mobility has shed ₹11b from its market cap this week, let's take a look at its longer term fundamental trends and see if they've driven returns.
In his essay The Superinvestors of Graham-and-Doddsville Warren Buffett described how share prices do not always rationally reflect the value of a business. One flawed but reasonable way to assess how sentiment around a company has changed is to compare the earnings per share (EPS) with the share price.
Over half a decade, Amara Raja Energy & Mobility managed to grow its earnings per share at 8.0% a year. This EPS growth is slower than the share price growth of 17% per year, over the same period. So it's fair to assume the market has a higher opinion of the business than it did five years ago. That's not necessarily surprising considering the five-year track record of earnings growth.
The image below shows how EPS has tracked over time (if you click on the image you can see greater detail).
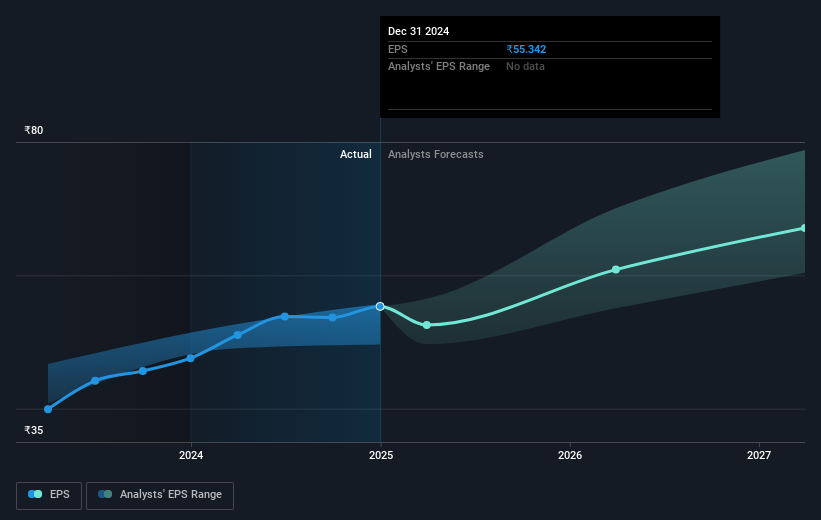
We know that Amara Raja Energy & Mobility has improved its bottom line lately, but is it going to grow revenue? You could check out this free report showing analyst revenue forecasts.
What About Dividends?
It is important to consider the total shareholder return, as well as the share price return, for any given stock. The TSR is a return calculation that accounts for the value of cash dividends (assuming that any dividend received was reinvested) and the calculated value of any discounted capital raisings and spin-offs. So for companies that pay a generous dividend, the TSR is often a lot higher than the share price return. As it happens, Amara Raja Energy & Mobility's TSR for the last 5 years was 128%, which exceeds the share price return mentioned earlier. And there's no prize for guessing that the dividend payments largely explain the divergence!
A Different Perspective
It's good to see that Amara Raja Energy & Mobility has rewarded shareholders with a total shareholder return of 33% in the last twelve months. That's including the dividend. That's better than the annualised return of 18% over half a decade, implying that the company is doing better recently. Someone with an optimistic perspective could view the recent improvement in TSR as indicating that the business itself is getting better with time. I find it very interesting to look at share price over the long term as a proxy for business performance. But to truly gain insight, we need to consider other information, too. Case in point: We've spotted 1 warning sign for Amara Raja Energy & Mobility you should be aware of.
If you like to buy stocks alongside management, then you might just love this free list of companies. (Hint: many of them are unnoticed AND have attractive valuation).
Please note, the market returns quoted in this article reflect the market weighted average returns of stocks that currently trade on Indian exchanges.
If you're looking to trade Amara Raja Energy & Mobility, open an account with the lowest-cost platform trusted by professionals, Interactive Brokers.
With clients in over 200 countries and territories, and access to 160 markets, IBKR lets you trade stocks, options, futures, forex, bonds and funds from a single integrated account.
Enjoy no hidden fees, no account minimums, and FX conversion rates as low as 0.03%, far better than what most brokers offer.
Sponsored ContentNew: Manage All Your Stock Portfolios in One Place
We've created the ultimate portfolio companion for stock investors, and it's free.
• Connect an unlimited number of Portfolios and see your total in one currency
• Be alerted to new Warning Signs or Risks via email or mobile
• Track the Fair Value of your stocks
Have feedback on this article? Concerned about the content? Get in touch with us directly. Alternatively, email editorial-team (at) simplywallst.com.
This article by Simply Wall St is general in nature. We provide commentary based on historical data and analyst forecasts only using an unbiased methodology and our articles are not intended to be financial advice. It does not constitute a recommendation to buy or sell any stock, and does not take account of your objectives, or your financial situation. We aim to bring you long-term focused analysis driven by fundamental data. Note that our analysis may not factor in the latest price-sensitive company announcements or qualitative material. Simply Wall St has no position in any stocks mentioned.
About NSEI:ARE&M
Amara Raja Energy & Mobility
Manufactures and sells lead-acid storage batteries for industrial and automotive applications in India and internationally.
Excellent balance sheet with proven track record and pays a dividend.
Market Insights

Community Narratives


