- India
- /
- Trade Distributors
- /
- NSEI:ABMINTLLTD
Revenues Working Against ABM International Limited's (NSE:ABMINTLLTD) Share Price Following 29% Dive


ABM International Limited (NSE:ABMINTLLTD) shareholders won't be pleased to see that the share price has had a very rough month, dropping 29% and undoing the prior period's positive performance. The drop over the last 30 days has capped off a tough year for shareholders, with the share price down 13% in that time.
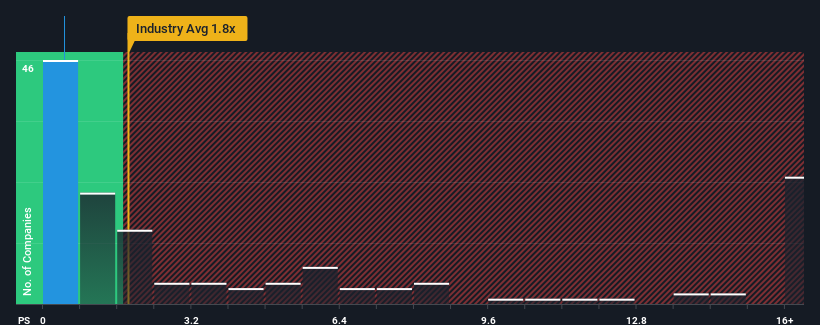
Even after such a large drop in price, ABM International may still be sending buy signals at present with its price-to-sales (or "P/S") ratio of 0.5x, considering almost half of all companies in the Trade Distributors industry in India have P/S ratios greater than 1.8x and even P/S higher than 8x aren't out of the ordinary. Although, it's not wise to just take the P/S at face value as there may be an explanation why it's limited.
Check out our latest analysis for ABM International
What Does ABM International's Recent Performance Look Like?
ABM International has been doing a good job lately as it's been growing revenue at a solid pace. It might be that many expect the respectable revenue performance to degrade substantially, which has repressed the P/S. If you like the company, you'd be hoping this isn't the case so that you could potentially pick up some stock while it's out of favour.
We don't have analyst forecasts, but you can see how recent trends are setting up the company for the future by checking out our free report on ABM International's earnings, revenue and cash flow.What Are Revenue Growth Metrics Telling Us About The Low P/S?
The only time you'd be truly comfortable seeing a P/S as low as ABM International's is when the company's growth is on track to lag the industry.
Taking a look back first, we see that the company grew revenue by an impressive 26% last year. However, this wasn't enough as the latest three year period has seen the company endure a nasty 14% drop in revenue in aggregate. Therefore, it's fair to say the revenue growth recently has been undesirable for the company.
Weighing that medium-term revenue trajectory against the broader industry's one-year forecast for expansion of 4.2% shows it's an unpleasant look.
With this information, we are not surprised that ABM International is trading at a P/S lower than the industry. However, we think shrinking revenues are unlikely to lead to a stable P/S over the longer term, which could set up shareholders for future disappointment. There's potential for the P/S to fall to even lower levels if the company doesn't improve its top-line growth.
The Bottom Line On ABM International's P/S
ABM International's recently weak share price has pulled its P/S back below other Trade Distributors companies. While the price-to-sales ratio shouldn't be the defining factor in whether you buy a stock or not, it's quite a capable barometer of revenue expectations.
Our examination of ABM International confirms that the company's shrinking revenue over the past medium-term is a key factor in its low price-to-sales ratio, given the industry is projected to grow. Right now shareholders are accepting the low P/S as they concede future revenue probably won't provide any pleasant surprises either. If recent medium-term revenue trends continue, it's hard to see the share price moving strongly in either direction in the near future under these circumstances.
We don't want to rain on the parade too much, but we did also find 3 warning signs for ABM International (1 shouldn't be ignored!) that you need to be mindful of.
If strong companies turning a profit tickle your fancy, then you'll want to check out this free list of interesting companies that trade on a low P/E (but have proven they can grow earnings).
If you're looking to trade ABM International, open an account with the lowest-cost platform trusted by professionals, Interactive Brokers.
With clients in over 200 countries and territories, and access to 160 markets, IBKR lets you trade stocks, options, futures, forex, bonds and funds from a single integrated account.
Enjoy no hidden fees, no account minimums, and FX conversion rates as low as 0.03%, far better than what most brokers offer.
Sponsored ContentNew: Manage All Your Stock Portfolios in One Place
We've created the ultimate portfolio companion for stock investors, and it's free.
• Connect an unlimited number of Portfolios and see your total in one currency
• Be alerted to new Warning Signs or Risks via email or mobile
• Track the Fair Value of your stocks
Have feedback on this article? Concerned about the content? Get in touch with us directly. Alternatively, email editorial-team (at) simplywallst.com.
This article by Simply Wall St is general in nature. We provide commentary based on historical data and analyst forecasts only using an unbiased methodology and our articles are not intended to be financial advice. It does not constitute a recommendation to buy or sell any stock, and does not take account of your objectives, or your financial situation. We aim to bring you long-term focused analysis driven by fundamental data. Note that our analysis may not factor in the latest price-sensitive company announcements or qualitative material. Simply Wall St has no position in any stocks mentioned.
About NSEI:ABMINTLLTD
ABM International
Engages in the importing and trading of plastic raw materials in India.
Acceptable track record with imperfect balance sheet.
Market Insights

Community Narratives


