- India
- /
- Auto Components
- /
- NSEI:SUPRAJIT
Suprajit Engineering (NSE:SUPRAJIT) sheds 7.3% this week, as yearly returns fall more in line with earnings growth


The most you can lose on any stock (assuming you don't use leverage) is 100% of your money. But on the bright side, you can make far more than 100% on a really good stock. For instance, the price of Suprajit Engineering Limited (NSE:SUPRAJIT) stock is up an impressive 223% over the last five years. It's also good to see the share price up 18% over the last quarter. But this move may well have been assisted by the reasonably buoyant market (up 12% in 90 days).
Although Suprajit Engineering has shed ₹5.7b from its market cap this week, let's take a look at its longer term fundamental trends and see if they've driven returns.
Check out our latest analysis for Suprajit Engineering
While the efficient markets hypothesis continues to be taught by some, it has been proven that markets are over-reactive dynamic systems, and investors are not always rational. One way to examine how market sentiment has changed over time is to look at the interaction between a company's share price and its earnings per share (EPS).
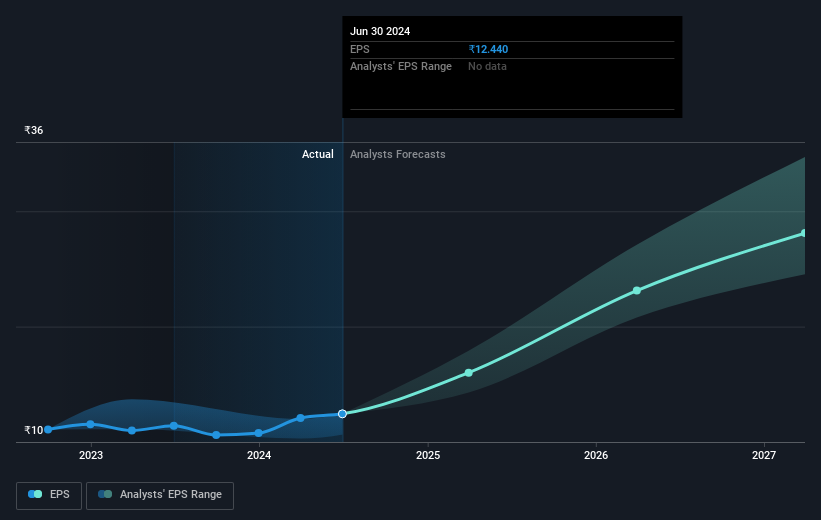
Over half a decade, Suprajit Engineering managed to grow its earnings per share at 6.0% a year. This EPS growth is lower than the 26% average annual increase in the share price. So it's fair to assume the market has a higher opinion of the business than it did five years ago. And that's hardly shocking given the track record of growth.
The graphic below depicts how EPS has changed over time (unveil the exact values by clicking on the image).
Before buying or selling a stock, we always recommend a close examination of historic growth trends, available here.
What About Dividends?
It is important to consider the total shareholder return, as well as the share price return, for any given stock. The TSR incorporates the value of any spin-offs or discounted capital raisings, along with any dividends, based on the assumption that the dividends are reinvested. Arguably, the TSR gives a more comprehensive picture of the return generated by a stock. In the case of Suprajit Engineering, it has a TSR of 233% for the last 5 years. That exceeds its share price return that we previously mentioned. This is largely a result of its dividend payments!
A Different Perspective
Suprajit Engineering shareholders gained a total return of 24% during the year. But that was short of the market average. On the bright side, the longer term returns (running at about 27% a year, over half a decade) look better. It's quite possible the business continues to execute with prowess, even as the share price gains are slowing. Is Suprajit Engineering cheap compared to other companies? These 3 valuation measures might help you decide.
Of course, you might find a fantastic investment by looking elsewhere. So take a peek at this free list of companies we expect will grow earnings.
Please note, the market returns quoted in this article reflect the market weighted average returns of stocks that currently trade on Indian exchanges.
If you're looking to trade Suprajit Engineering, open an account with the lowest-cost platform trusted by professionals, Interactive Brokers.
With clients in over 200 countries and territories, and access to 160 markets, IBKR lets you trade stocks, options, futures, forex, bonds and funds from a single integrated account.
Enjoy no hidden fees, no account minimums, and FX conversion rates as low as 0.03%, far better than what most brokers offer.
Sponsored ContentNew: Manage All Your Stock Portfolios in One Place
We've created the ultimate portfolio companion for stock investors, and it's free.
• Connect an unlimited number of Portfolios and see your total in one currency
• Be alerted to new Warning Signs or Risks via email or mobile
• Track the Fair Value of your stocks
Have feedback on this article? Concerned about the content? Get in touch with us directly. Alternatively, email editorial-team (at) simplywallst.com.
This article by Simply Wall St is general in nature. We provide commentary based on historical data and analyst forecasts only using an unbiased methodology and our articles are not intended to be financial advice. It does not constitute a recommendation to buy or sell any stock, and does not take account of your objectives, or your financial situation. We aim to bring you long-term focused analysis driven by fundamental data. Note that our analysis may not factor in the latest price-sensitive company announcements or qualitative material. Simply Wall St has no position in any stocks mentioned.
About NSEI:SUPRAJIT
Suprajit Engineering
Manufactures and sells automotive cables, halogen lamps, speedometers, and other automotive components in India, the United States, the United Kingdom, Germany, and Luxembourg.
Excellent balance sheet established dividend payer.
Similar Companies
Market Insights

Community Narratives


