
Howard Marks put it nicely when he said that, rather than worrying about share price volatility, 'The possibility of permanent loss is the risk I worry about... and every practical investor I know worries about.' So it seems the smart money knows that debt - which is usually involved in bankruptcies - is a very important factor, when you assess how risky a company is. As with many other companies G N A Axles Limited (NSE:GNA) makes use of debt. But the more important question is: how much risk is that debt creating?
What Risk Does Debt Bring?
Debt assists a business until the business has trouble paying it off, either with new capital or with free cash flow. In the worst case scenario, a company can go bankrupt if it cannot pay its creditors. However, a more common (but still painful) scenario is that it has to raise new equity capital at a low price, thus permanently diluting shareholders. Of course, plenty of companies use debt to fund growth, without any negative consequences. When we think about a company's use of debt, we first look at cash and debt together.
View our latest analysis for G N A Axles
How Much Debt Does G N A Axles Carry?
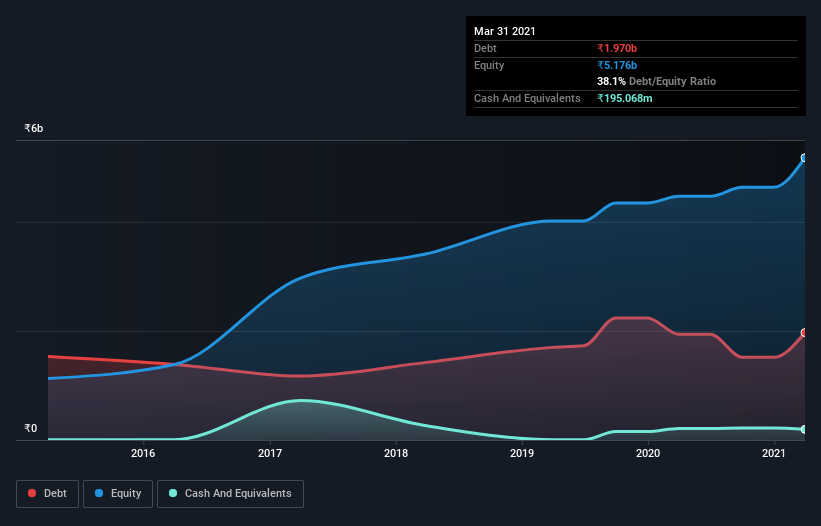
As you can see below, G N A Axles had ₹1.97b of debt, at March 2021, which is about the same as the year before. You can click the chart for greater detail. However, it also had ₹195.1m in cash, and so its net debt is ₹1.77b.
A Look At G N A Axles' Liabilities
The latest balance sheet data shows that G N A Axles had liabilities of ₹3.65b due within a year, and liabilities of ₹769.1m falling due after that. On the other hand, it had cash of ₹195.1m and ₹4.38b worth of receivables due within a year. So it can boast ₹154.6m more liquid assets than total liabilities.
This state of affairs indicates that G N A Axles' balance sheet looks quite solid, as its total liabilities are just about equal to its liquid assets. So while it's hard to imagine that the ₹8.14b company is struggling for cash, we still think it's worth monitoring its balance sheet.
We use two main ratios to inform us about debt levels relative to earnings. The first is net debt divided by earnings before interest, tax, depreciation, and amortization (EBITDA), while the second is how many times its earnings before interest and tax (EBIT) covers its interest expense (or its interest cover, for short). This way, we consider both the absolute quantum of the debt, as well as the interest rates paid on it.
G N A Axles's net debt is only 1.2 times its EBITDA. And its EBIT covers its interest expense a whopping 12.1 times over. So we're pretty relaxed about its super-conservative use of debt. In addition to that, we're happy to report that G N A Axles has boosted its EBIT by 55%, thus reducing the spectre of future debt repayments. When analysing debt levels, the balance sheet is the obvious place to start. But you can't view debt in total isolation; since G N A Axles will need earnings to service that debt. So if you're keen to discover more about its earnings, it might be worth checking out this graph of its long term earnings trend.
Finally, a company can only pay off debt with cold hard cash, not accounting profits. So we always check how much of that EBIT is translated into free cash flow. In the last three years, G N A Axles basically broke even on a free cash flow basis. Some might say that's a concern, when it comes considering how easily it would be for it to down debt.
Our View
Happily, G N A Axles's impressive interest cover implies it has the upper hand on its debt. But the stark truth is that we are concerned by its conversion of EBIT to free cash flow. When we consider the range of factors above, it looks like G N A Axles is pretty sensible with its use of debt. That means they are taking on a bit more risk, in the hope of boosting shareholder returns. When analysing debt levels, the balance sheet is the obvious place to start. But ultimately, every company can contain risks that exist outside of the balance sheet. Case in point: We've spotted 1 warning sign for G N A Axles you should be aware of.
If you're interested in investing in businesses that can grow profits without the burden of debt, then check out this free list of growing businesses that have net cash on the balance sheet.
When trading G N A Axles or any other investment, use the platform considered by many to be the Professional's Gateway to the Worlds Market, Interactive Brokers. You get the lowest-cost* trading on stocks, options, futures, forex, bonds and funds worldwide from a single integrated account. Promoted
The New Payments ETF Is Live on NASDAQ:
Money is moving to real-time rails, and a newly listed ETF now gives investors direct exposure. Fast settlement. Institutional custody. Simple access.
Explore how this launch could reshape portfolios
Sponsored ContentNew: Manage All Your Stock Portfolios in One Place
We've created the ultimate portfolio companion for stock investors, and it's free.
• Connect an unlimited number of Portfolios and see your total in one currency
• Be alerted to new Warning Signs or Risks via email or mobile
• Track the Fair Value of your stocks
This article by Simply Wall St is general in nature. It does not constitute a recommendation to buy or sell any stock, and does not take account of your objectives, or your financial situation. We aim to bring you long-term focused analysis driven by fundamental data. Note that our analysis may not factor in the latest price-sensitive company announcements or qualitative material. Simply Wall St has no position in any stocks mentioned.
*Interactive Brokers Rated Lowest Cost Broker by StockBrokers.com Annual Online Review 2020
Have feedback on this article? Concerned about the content? Get in touch with us directly. Alternatively, email editorial-team (at) simplywallst.com.
About NSEI:GNA
G N A Axles
Manufactures and sells automotive transmission components for the four-wheeler industry in North America, South America, Europe, Asia, and Australia.
Flawless balance sheet with solid track record.
Similar Companies
Market Insights

Weekly Picks

THE KINGDOM OF BROWN GOODS: WHY MGPI IS BEING CRUSHED BY INVENTORY & PRIMED FOR RESURRECTION


Why Vertical Aerospace (NYSE: EVTL) is Worth Possibly Over 13x its Current Price


The Quiet Giant That Became AI’s Power Grid
Recently Updated Narratives
Why Vertical Aerospace (NYSE: EVTL) is Worth Possibly Over 13x its Current Price

Deep Value Multi Bagger Opportunity


A case for CA$31.80 (undiluted), aka 8,616% upside from CA$0.37 (an 86 bagger!).
Popular Narratives


MicroVision will explode future revenue by 380.37% with a vision towards success


NVDA: Expanding AI Demand Will Drive Major Data Center Investments Through 2026


Crazy Undervalued 42 Baggers Silver Play (Active & Running Mine)
Trending Discussion


Thanks for sharing these. They really help when I pick what dividend stocks to invest in
