- India
- /
- Auto Components
- /
- NSEI:DYNAMATECH
A Sliding Share Price Has Us Looking At Dynamatic Technologies Limited's (NSE:DYNAMATECH) P/E Ratio

To the annoyance of some shareholders, Dynamatic Technologies (NSE:DYNAMATECH) shares are down a considerable 32% in the last month. Indeed the recent decline has arguably caused some bitterness for shareholders who have held through the 46% drop over twelve months.
Assuming nothing else has changed, a lower share price makes a stock more attractive to potential buyers. In the long term, share prices tend to follow earnings per share, but in the short term prices bounce around in response to short term factors (which are not always obvious). So, on certain occasions, long term focussed investors try to take advantage of pessimistic expectations to buy shares at a better price. Perhaps the simplest way to get a read on investors' expectations of a business is to look at its Price to Earnings Ratio (PE Ratio). A high P/E implies that investors have high expectations of what a company can achieve compared to a company with a low P/E ratio.
View our latest analysis for Dynamatic Technologies
Does Dynamatic Technologies Have A Relatively High Or Low P/E For Its Industry?
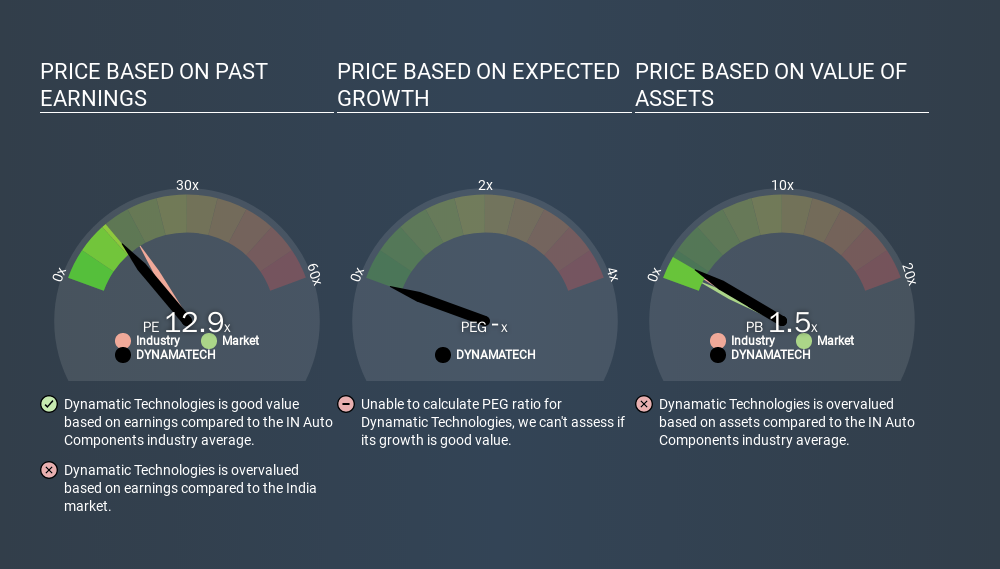
Dynamatic Technologies's P/E of 12.86 indicates relatively low sentiment towards the stock. If you look at the image below, you can see Dynamatic Technologies has a lower P/E than the average (16.3) in the auto components industry classification.
Dynamatic Technologies's P/E tells us that market participants think it will not fare as well as its peers in the same industry. Many investors like to buy stocks when the market is pessimistic about their prospects. It is arguably worth checking if insiders are buying shares, because that might imply they believe the stock is undervalued.
How Growth Rates Impact P/E Ratios
If earnings fall then in the future the 'E' will be lower. That means unless the share price falls, the P/E will increase in a few years. So while a stock may look cheap based on past earnings, it could be expensive based on future earnings.
Dynamatic Technologies's earnings made like a rocket, taking off 72% last year. Unfortunately, earnings per share are down 1.9% a year, over 3 years.
Don't Forget: The P/E Does Not Account For Debt or Bank Deposits
It's important to note that the P/E ratio considers the market capitalization, not the enterprise value. So it won't reflect the advantage of cash, or disadvantage of debt. The exact same company would hypothetically deserve a higher P/E ratio if it had a strong balance sheet, than if it had a weak one with lots of debt, because a cashed up company can spend on growth.
Spending on growth might be good or bad a few years later, but the point is that the P/E ratio does not account for the option (or lack thereof).
So What Does Dynamatic Technologies's Balance Sheet Tell Us?
Dynamatic Technologies's net debt is considerable, at 114% of its market cap. If you want to compare its P/E ratio to other companies, you must keep in mind that these debt levels would usually warrant a relatively low P/E.
The Bottom Line On Dynamatic Technologies's P/E Ratio
Dynamatic Technologies's P/E is 12.9 which is about average (12.3) in the IN market. It does have enough debt to add risk, although earnings growth was strong in the last year. The P/E suggests that the market is not convinced EPS will continue to improve strongly. What can be absolutely certain is that the market has become significantly less optimistic about Dynamatic Technologies over the last month, with the P/E ratio falling from 18.9 back then to 12.9 today. For those who prefer to invest with the flow of momentum, that might be a bad sign, but for a contrarian, it may signal opportunity.
Investors should be looking to buy stocks that the market is wrong about. People often underestimate remarkable growth -- so investors can make money when fast growth is not fully appreciated. Although we don't have analyst forecasts you could get a better understanding of its growth by checking out this more detailed historical graph of earnings, revenue and cash flow.
You might be able to find a better buy than Dynamatic Technologies. If you want a selection of possible winners, check out this free list of interesting companies that trade on a P/E below 20 (but have proven they can grow earnings).
If you spot an error that warrants correction, please contact the editor at editorial-team@simplywallst.com. This article by Simply Wall St is general in nature. It does not constitute a recommendation to buy or sell any stock, and does not take account of your objectives, or your financial situation. Simply Wall St has no position in the stocks mentioned.
We aim to bring you long-term focused research analysis driven by fundamental data. Note that our analysis may not factor in the latest price-sensitive company announcements or qualitative material. Thank you for reading.
About NSEI:DYNAMATECH
Dynamatic Technologies
Manufactures and sells engineered products to the aerospace, automotive, and hydraulic industries in India, the United States, the United Kingdom, rest of Europe, Canada, and internationally.
Reasonable growth potential with adequate balance sheet.
Similar Companies
Market Insights

Weekly Picks

Early mover in a fast growing industry. Likely to experience share price volatility as they scale


A case for CA$31.80 (undiluted), aka 8,616% upside from CA$0.37 (an 86 bagger!).


Moderation and Stabilisation: HOLD: Fair Price based on a 4-year Cycle is $12.08
Recently Updated Narratives

A case for USD $14.81 per share based on book value. Be warned, this is a micro-cap dependent on a single mine.

Occidental Petroleum to Become Fairly Priced at $68.29 According to Future Projections

Agfa-Gevaert is a digital and materials turnaround opportunity, with growth potential in ZIRFON, but carrying legacy risks.
Popular Narratives


MicroVision will explode future revenue by 380.37% with a vision towards success


Crazy Undervalued 42 Baggers Silver Play (Active & Running Mine)


