
Advertisement

Legendary fund manager Li Lu (who Charlie Munger backed) once said, 'The biggest investment risk is not the volatility of prices, but whether you will suffer a permanent loss of capital.' So it seems the smart money knows that debt - which is usually involved in bankruptcies - is a very important factor, when you assess how risky a company is. As with many other companies Mishorim Real Estate Investments Ltd (TLV:MSHR) makes use of debt. But should shareholders be worried about its use of debt?
Why Does Debt Bring Risk?
Debt is a tool to help businesses grow, but if a business is incapable of paying off its lenders, then it exists at their mercy. Ultimately, if the company can't fulfill its legal obligations to repay debt, shareholders could walk away with nothing. While that is not too common, we often do see indebted companies permanently diluting shareholders because lenders force them to raise capital at a distressed price. Of course, the upside of debt is that it often represents cheap capital, especially when it replaces dilution in a company with the ability to reinvest at high rates of return. The first thing to do when considering how much debt a business uses is to look at its cash and debt together.
Check out our latest analysis for Mishorim Real Estate Investments
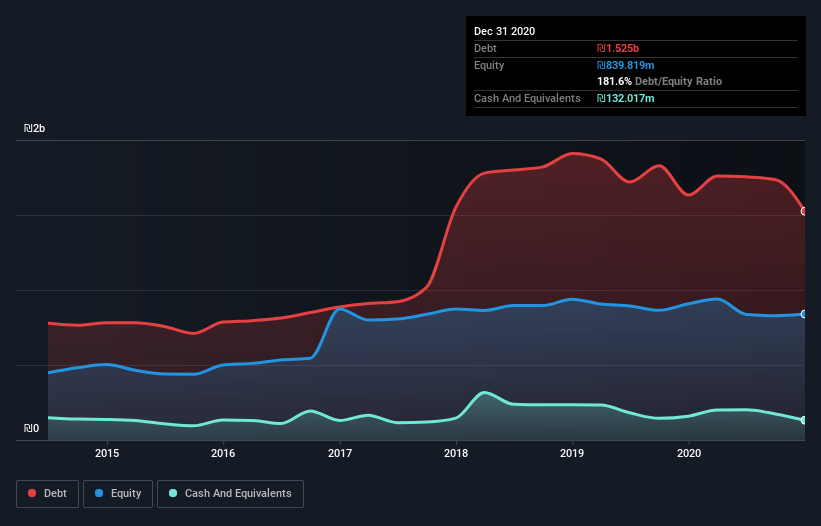
What Is Mishorim Real Estate Investments's Net Debt?
You can click the graphic below for the historical numbers, but it shows that Mishorim Real Estate Investments had ₪1.53b of debt in December 2020, down from ₪1.63b, one year before. On the flip side, it has ₪132.0m in cash leading to net debt of about ₪1.39b.
How Strong Is Mishorim Real Estate Investments' Balance Sheet?
Zooming in on the latest balance sheet data, we can see that Mishorim Real Estate Investments had liabilities of ₪410.1m due within 12 months and liabilities of ₪1.54b due beyond that. Offsetting this, it had ₪132.0m in cash and ₪60.5m in receivables that were due within 12 months. So it has liabilities totalling ₪1.76b more than its cash and near-term receivables, combined.
The deficiency here weighs heavily on the ₪269.7m company itself, as if a child were struggling under the weight of an enormous back-pack full of books, his sports gear, and a trumpet. So we'd watch its balance sheet closely, without a doubt. At the end of the day, Mishorim Real Estate Investments would probably need a major re-capitalization if its creditors were to demand repayment.
We measure a company's debt load relative to its earnings power by looking at its net debt divided by its earnings before interest, tax, depreciation, and amortization (EBITDA) and by calculating how easily its earnings before interest and tax (EBIT) cover its interest expense (interest cover). This way, we consider both the absolute quantum of the debt, as well as the interest rates paid on it.
Mishorim Real Estate Investments shareholders face the double whammy of a high net debt to EBITDA ratio (18.7), and fairly weak interest coverage, since EBIT is just 0.26 times the interest expense. The debt burden here is substantial. Even worse, Mishorim Real Estate Investments saw its EBIT tank 78% over the last 12 months. If earnings keep going like that over the long term, it has a snowball's chance in hell of paying off that debt. The balance sheet is clearly the area to focus on when you are analysing debt. But you can't view debt in total isolation; since Mishorim Real Estate Investments will need earnings to service that debt. So if you're keen to discover more about its earnings, it might be worth checking out this graph of its long term earnings trend.
Finally, a business needs free cash flow to pay off debt; accounting profits just don't cut it. So we clearly need to look at whether that EBIT is leading to corresponding free cash flow. Over the most recent three years, Mishorim Real Estate Investments recorded free cash flow worth 73% of its EBIT, which is around normal, given free cash flow excludes interest and tax. This free cash flow puts the company in a good position to pay down debt, when appropriate.
Our View
To be frank both Mishorim Real Estate Investments's EBIT growth rate and its track record of staying on top of its total liabilities make us rather uncomfortable with its debt levels. But on the bright side, its conversion of EBIT to free cash flow is a good sign, and makes us more optimistic. Taking into account all the aforementioned factors, it looks like Mishorim Real Estate Investments has too much debt. That sort of riskiness is ok for some, but it certainly doesn't float our boat. When analysing debt levels, the balance sheet is the obvious place to start. But ultimately, every company can contain risks that exist outside of the balance sheet. To that end, you should learn about the 3 warning signs we've spotted with Mishorim Real Estate Investments (including 2 which don't sit too well with us) .
At the end of the day, it's often better to focus on companies that are free from net debt. You can access our special list of such companies (all with a track record of profit growth). It's free.
If you’re looking to trade a wide range of investments, open an account with the lowest-cost* platform trusted by professionals, Interactive Brokers. Their clients from over 200 countries and territories trade stocks, options, futures, forex, bonds and funds worldwide from a single integrated account. Promoted
New: Manage All Your Stock Portfolios in One Place
We've created the ultimate portfolio companion for stock investors, and it's free.
• Connect an unlimited number of Portfolios and see your total in one currency
• Be alerted to new Warning Signs or Risks via email or mobile
• Track the Fair Value of your stocks
This article by Simply Wall St is general in nature. It does not constitute a recommendation to buy or sell any stock, and does not take account of your objectives, or your financial situation. We aim to bring you long-term focused analysis driven by fundamental data. Note that our analysis may not factor in the latest price-sensitive company announcements or qualitative material. Simply Wall St has no position in any stocks mentioned.
*Interactive Brokers Rated Lowest Cost Broker by StockBrokers.com Annual Online Review 2020
Have feedback on this article? Concerned about the content? Get in touch with us directly. Alternatively, email editorial-team (at) simplywallst.com.
About TASE:MSHR
Mishorim Real Estate Investments
Invests in, develops, rents, manages, operates, and sells real estate properties in Israel.
Low and slightly overvalued.
Market Insights

Advertisement
Community Narratives
Scaling up in building materials with smart M&A and growing profitability
Fair Value US$2.77|29.6% undervalued
CM
Community Contributor
Hims: The Platform Powering Personalised Healthcare
Fair Value US$114.01|49.1% undervalued
BL
Community Contributor
Undervalued lottery company with strong fundamentals
Fair Value AU$15.00|35.4% undervalued
RO
Community Contributor
Proximus, transferring money from the impatient to the patient investor
Fair Value €16.62|54.5% undervalued
AX
Community Contributor