- Israel
- /
- Real Estate
- /
- TASE:DIMRI
The total return for Y.H. Dimri Construction & Development (TLV:DIMRI) investors has risen faster than earnings growth over the last five years


The most you can lose on any stock (assuming you don't use leverage) is 100% of your money. But on the bright side, you can make far more than 100% on a really good stock. One great example is Y.H. Dimri Construction & Development Ltd (TLV:DIMRI) which saw its share price drive 177% higher over five years. In the last week shares have slid back 6.4%.
Since the long term performance has been good but there's been a recent pullback of 6.4%, let's check if the fundamentals match the share price.
View our latest analysis for Y.H. Dimri Construction & Development
In his essay The Superinvestors of Graham-and-Doddsville Warren Buffett described how share prices do not always rationally reflect the value of a business. One imperfect but simple way to consider how the market perception of a company has shifted is to compare the change in the earnings per share (EPS) with the share price movement.
Over half a decade, Y.H. Dimri Construction & Development managed to grow its earnings per share at 25% a year. So the EPS growth rate is rather close to the annualized share price gain of 23% per year. That suggests that the market sentiment around the company hasn't changed much over that time. Indeed, it would appear the share price is reacting to the EPS.
You can see how EPS has changed over time in the image below (click on the chart to see the exact values).
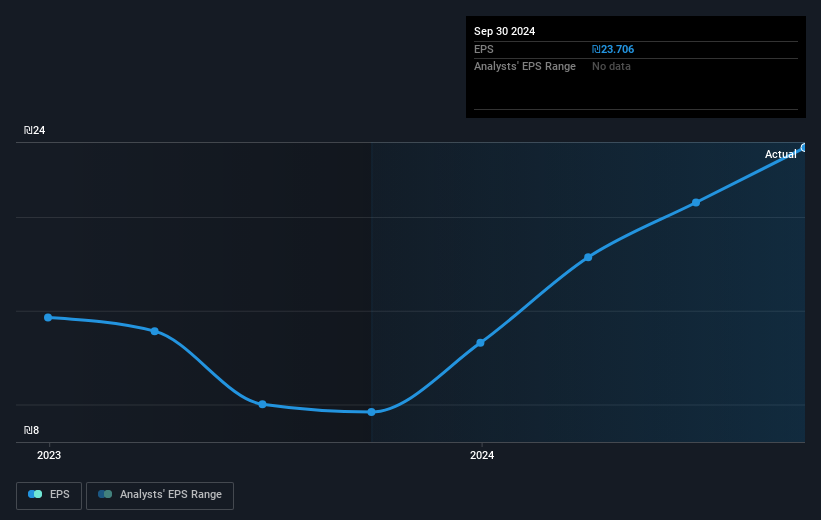
Dive deeper into Y.H. Dimri Construction & Development's key metrics by checking this interactive graph of Y.H. Dimri Construction & Development's earnings, revenue and cash flow.
What About Dividends?
When looking at investment returns, it is important to consider the difference between total shareholder return (TSR) and share price return. Whereas the share price return only reflects the change in the share price, the TSR includes the value of dividends (assuming they were reinvested) and the benefit of any discounted capital raising or spin-off. Arguably, the TSR gives a more comprehensive picture of the return generated by a stock. As it happens, Y.H. Dimri Construction & Development's TSR for the last 5 years was 207%, which exceeds the share price return mentioned earlier. And there's no prize for guessing that the dividend payments largely explain the divergence!
A Different Perspective
Y.H. Dimri Construction & Development provided a TSR of 28% over the last twelve months. But that was short of the market average. On the bright side, that's still a gain, and it's actually better than the average return of 25% over half a decade This could indicate that the company is winning over new investors, as it pursues its strategy. While it is well worth considering the different impacts that market conditions can have on the share price, there are other factors that are even more important. To that end, you should learn about the 2 warning signs we've spotted with Y.H. Dimri Construction & Development (including 1 which is a bit unpleasant) .
For those who like to find winning investments this free list of undervalued companies with recent insider purchasing, could be just the ticket.
Please note, the market returns quoted in this article reflect the market weighted average returns of stocks that currently trade on Israeli exchanges.
New: Manage All Your Stock Portfolios in One Place
We've created the ultimate portfolio companion for stock investors, and it's free.
• Connect an unlimited number of Portfolios and see your total in one currency
• Be alerted to new Warning Signs or Risks via email or mobile
• Track the Fair Value of your stocks
Have feedback on this article? Concerned about the content? Get in touch with us directly. Alternatively, email editorial-team (at) simplywallst.com.
This article by Simply Wall St is general in nature. We provide commentary based on historical data and analyst forecasts only using an unbiased methodology and our articles are not intended to be financial advice. It does not constitute a recommendation to buy or sell any stock, and does not take account of your objectives, or your financial situation. We aim to bring you long-term focused analysis driven by fundamental data. Note that our analysis may not factor in the latest price-sensitive company announcements or qualitative material. Simply Wall St has no position in any stocks mentioned.
About TASE:DIMRI
Y.H. Dimri Construction & Development
Operates as a real estate company in Israel, Romania, and the Czech Republic.
Solid track record with mediocre balance sheet.
Similar Companies
Market Insights

Community Narratives

