Tikun Olam-Cannbit Pharmaceuticals Ltd (TLV:TKUN) Stocks Shoot Up 27% But Its P/S Still Looks Reasonable


Tikun Olam-Cannbit Pharmaceuticals Ltd (TLV:TKUN) shareholders would be excited to see that the share price has had a great month, posting a 27% gain and recovering from prior weakness. Longer-term shareholders would be thankful for the recovery in the share price since it's now virtually flat for the year after the recent bounce.
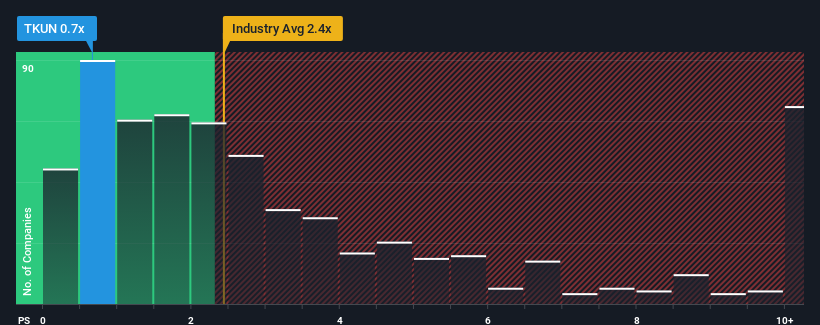
Although its price has surged higher, you could still be forgiven for feeling indifferent about Tikun Olam-Cannbit Pharmaceuticals' P/S ratio of 0.7x, since the median price-to-sales (or "P/S") ratio for the Pharmaceuticals industry in Israel is also close to 0.6x. However, investors might be overlooking a clear opportunity or potential setback if there is no rational basis for the P/S.
Check out our latest analysis for Tikun Olam-Cannbit Pharmaceuticals
How Has Tikun Olam-Cannbit Pharmaceuticals Performed Recently?
For instance, Tikun Olam-Cannbit Pharmaceuticals' receding revenue in recent times would have to be some food for thought. One possibility is that the P/S is moderate because investors think the company might still do enough to be in line with the broader industry in the near future. If not, then existing shareholders may be a little nervous about the viability of the share price.
Want the full picture on earnings, revenue and cash flow for the company? Then our free report on Tikun Olam-Cannbit Pharmaceuticals will help you shine a light on its historical performance.Do Revenue Forecasts Match The P/S Ratio?
Tikun Olam-Cannbit Pharmaceuticals' P/S ratio would be typical for a company that's only expected to deliver moderate growth, and importantly, perform in line with the industry.
In reviewing the last year of financials, we were disheartened to see the company's revenues fell to the tune of 10%. However, a few very strong years before that means that it was still able to grow revenue by an impressive 104% in total over the last three years. Accordingly, while they would have preferred to keep the run going, shareholders would definitely welcome the medium-term rates of revenue growth.
Comparing that to the industry, which is predicted to deliver 27% growth in the next 12 months, the company's momentum is pretty similar based on recent medium-term annualised revenue results.
With this in consideration, it's clear to see why Tikun Olam-Cannbit Pharmaceuticals' P/S matches up closely to its industry peers. It seems most investors are expecting to see average growth rates continue into the future and are only willing to pay a moderate amount for the stock.
The Bottom Line On Tikun Olam-Cannbit Pharmaceuticals' P/S
Tikun Olam-Cannbit Pharmaceuticals' stock has a lot of momentum behind it lately, which has brought its P/S level with the rest of the industry. We'd say the price-to-sales ratio's power isn't primarily as a valuation instrument but rather to gauge current investor sentiment and future expectations.
As we've seen, Tikun Olam-Cannbit Pharmaceuticals' three-year revenue trends seem to be contributing to its P/S, given they look similar to current industry expectations. Currently, with a past revenue trend that aligns closely wit the industry outlook, shareholders are confident the company's future revenue outlook won't contain any major surprises. Unless the recent medium-term conditions change, they will continue to support the share price at these levels.
And what about other risks? Every company has them, and we've spotted 5 warning signs for Tikun Olam-Cannbit Pharmaceuticals (of which 4 can't be ignored!) you should know about.
If these risks are making you reconsider your opinion on Tikun Olam-Cannbit Pharmaceuticals, explore our interactive list of high quality stocks to get an idea of what else is out there.
If you're looking to trade Tikun Olam-Cannbit Pharmaceuticals, open an account with the lowest-cost platform trusted by professionals, Interactive Brokers.
With clients in over 200 countries and territories, and access to 160 markets, IBKR lets you trade stocks, options, futures, forex, bonds and funds from a single integrated account.
Enjoy no hidden fees, no account minimums, and FX conversion rates as low as 0.03%, far better than what most brokers offer.
Sponsored ContentValuation is complex, but we're here to simplify it.
Discover if Tikun Olam-Cannbit Pharmaceuticals might be undervalued or overvalued with our detailed analysis, featuring fair value estimates, potential risks, dividends, insider trades, and its financial condition.
Access Free AnalysisHave feedback on this article? Concerned about the content? Get in touch with us directly. Alternatively, email editorial-team (at) simplywallst.com.
This article by Simply Wall St is general in nature. We provide commentary based on historical data and analyst forecasts only using an unbiased methodology and our articles are not intended to be financial advice. It does not constitute a recommendation to buy or sell any stock, and does not take account of your objectives, or your financial situation. We aim to bring you long-term focused analysis driven by fundamental data. Note that our analysis may not factor in the latest price-sensitive company announcements or qualitative material. Simply Wall St has no position in any stocks mentioned.
About TASE:TKUN
Tikun Olam-Cannbit Pharmaceuticals
Engages in the cultivation, production, marketing, storage, distribution, export and import, and sale of cannabis-based products in Israel.
Moderate and slightly overvalued.
Market Insights

Community Narratives


