

Key Insights
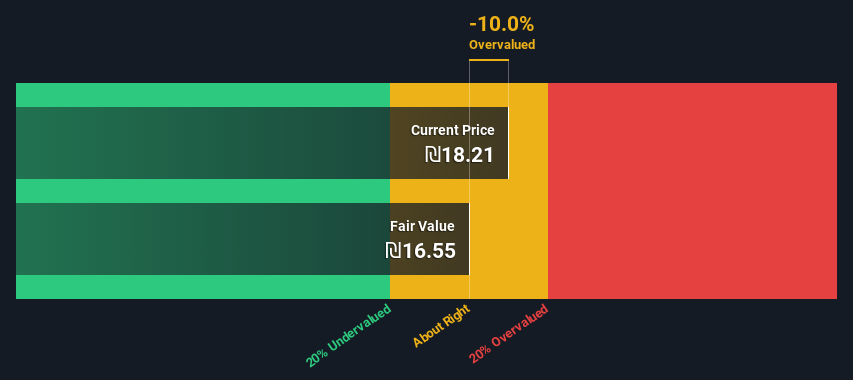
- Using the 2 Stage Free Cash Flow to Equity, ICL Group fair value estimate is ₪16.55
- With ₪18.21 share price, ICL Group appears to be trading close to its estimated fair value
- Analyst price target for ICL is US$20.08, which is 21% above our fair value estimate
In this article we are going to estimate the intrinsic value of ICL Group Ltd (TLV:ICL) by estimating the company's future cash flows and discounting them to their present value. One way to achieve this is by employing the Discounted Cash Flow (DCF) model. Don't get put off by the jargon, the math behind it is actually quite straightforward.
We generally believe that a company's value is the present value of all of the cash it will generate in the future. However, a DCF is just one valuation metric among many, and it is not without flaws. If you want to learn more about discounted cash flow, the rationale behind this calculation can be read in detail in the Simply Wall St analysis model.
See our latest analysis for ICL Group
Is ICL Group Fairly Valued?
We use what is known as a 2-stage model, which simply means we have two different periods of growth rates for the company's cash flows. Generally the first stage is higher growth, and the second stage is a lower growth phase. To begin with, we have to get estimates of the next ten years of cash flows. Where possible we use analyst estimates, but when these aren't available we extrapolate the previous free cash flow (FCF) from the last estimate or reported value. We assume companies with shrinking free cash flow will slow their rate of shrinkage, and that companies with growing free cash flow will see their growth rate slow, over this period. We do this to reflect that growth tends to slow more in the early years than it does in later years.
Generally we assume that a dollar today is more valuable than a dollar in the future, so we need to discount the sum of these future cash flows to arrive at a present value estimate:
10-year free cash flow (FCF) estimate
| 2024 | 2025 | 2026 | 2027 | 2028 | 2029 | 2030 | 2031 | 2032 | 2033 | |
| Levered FCF ($, Millions) | US$443.0m | US$623.0m | US$521.2m | US$464.7m | US$432.2m | US$413.7m | US$403.7m | US$399.3m | US$398.6m | US$400.6m |
| Growth Rate Estimate Source | Analyst x1 | Analyst x1 | Est @ -16.34% | Est @ -10.84% | Est @ -6.99% | Est @ -4.30% | Est @ -2.41% | Est @ -1.09% | Est @ -0.17% | Est @ 0.48% |
| Present Value ($, Millions) Discounted @ 8.4% | US$409 | US$531 | US$410 | US$337 | US$289 | US$255 | US$230 | US$210 | US$193 | US$179 |
("Est" = FCF growth rate estimated by Simply Wall St)
Present Value of 10-year Cash Flow (PVCF) = US$3.0b
We now need to calculate the Terminal Value, which accounts for all the future cash flows after this ten year period. The Gordon Growth formula is used to calculate Terminal Value at a future annual growth rate equal to the 5-year average of the 10-year government bond yield of 2.0%. We discount the terminal cash flows to today's value at a cost of equity of 8.4%.
Terminal Value (TV)= FCF2033 × (1 + g) ÷ (r – g) = US$401m× (1 + 2.0%) ÷ (8.4%– 2.0%) = US$6.4b
Present Value of Terminal Value (PVTV)= TV / (1 + r)10= US$6.4b÷ ( 1 + 8.4%)10= US$2.9b
The total value is the sum of cash flows for the next ten years plus the discounted terminal value, which results in the Total Equity Value, which in this case is US$5.9b. The last step is to then divide the equity value by the number of shares outstanding. Compared to the current share price of ₪18.2, the company appears around fair value at the time of writing. Valuations are imprecise instruments though, rather like a telescope - move a few degrees and end up in a different galaxy. Do keep this in mind.
The Assumptions
The calculation above is very dependent on two assumptions. The first is the discount rate and the other is the cash flows. If you don't agree with these result, have a go at the calculation yourself and play with the assumptions. The DCF also does not consider the possible cyclicality of an industry, or a company's future capital requirements, so it does not give a full picture of a company's potential performance. Given that we are looking at ICL Group as potential shareholders, the cost of equity is used as the discount rate, rather than the cost of capital (or weighted average cost of capital, WACC) which accounts for debt. In this calculation we've used 8.4%, which is based on a levered beta of 1.133. Beta is a measure of a stock's volatility, compared to the market as a whole. We get our beta from the industry average beta of globally comparable companies, with an imposed limit between 0.8 and 2.0, which is a reasonable range for a stable business.
SWOT Analysis for ICL Group
- Debt is not viewed as a risk.
- Dividend is in the top 25% of dividend payers in the market.
- Earnings declined over the past year.
- Current share price is above our estimate of fair value.
- ICL's financial characteristics indicate limited near-term opportunities for shareholders.
- Dividends are not covered by cash flow.
- Annual earnings are forecast to decline for the next 3 years.
Moving On:
Whilst important, the DCF calculation is only one of many factors that you need to assess for a company. The DCF model is not a perfect stock valuation tool. Preferably you'd apply different cases and assumptions and see how they would impact the company's valuation. For instance, if the terminal value growth rate is adjusted slightly, it can dramatically alter the overall result. For ICL Group, we've compiled three important items you should further examine:
- Risks: For instance, we've identified 3 warning signs for ICL Group (1 is a bit unpleasant) you should be aware of.
- Future Earnings: How does ICL's growth rate compare to its peers and the wider market? Dig deeper into the analyst consensus number for the upcoming years by interacting with our free analyst growth expectation chart.
- Other Solid Businesses: Low debt, high returns on equity and good past performance are fundamental to a strong business. Why not explore our interactive list of stocks with solid business fundamentals to see if there are other companies you may not have considered!
PS. The Simply Wall St app conducts a discounted cash flow valuation for every stock on the TASE every day. If you want to find the calculation for other stocks just search here.
If you're looking to trade ICL Group, open an account with the lowest-cost platform trusted by professionals, Interactive Brokers.
With clients in over 200 countries and territories, and access to 160 markets, IBKR lets you trade stocks, options, futures, forex, bonds and funds from a single integrated account.
Enjoy no hidden fees, no account minimums, and FX conversion rates as low as 0.03%, far better than what most brokers offer.
Sponsored ContentNew: AI Stock Screener & Alerts
Our new AI Stock Screener scans the market every day to uncover opportunities.
• Dividend Powerhouses (3%+ Yield)
• Undervalued Small Caps with Insider Buying
• High growth Tech and AI Companies
Or build your own from over 50 metrics.
Have feedback on this article? Concerned about the content? Get in touch with us directly. Alternatively, email editorial-team (at) simplywallst.com.
This article by Simply Wall St is general in nature. We provide commentary based on historical data and analyst forecasts only using an unbiased methodology and our articles are not intended to be financial advice. It does not constitute a recommendation to buy or sell any stock, and does not take account of your objectives, or your financial situation. We aim to bring you long-term focused analysis driven by fundamental data. Note that our analysis may not factor in the latest price-sensitive company announcements or qualitative material. Simply Wall St has no position in any stocks mentioned.
About TASE:ICL
ICL Group
Operates as a specialty minerals and chemicals company worldwide.
Flawless balance sheet with moderate growth potential.

