
Advertisement
Investors five-year losses continue as I.D.I. Insurance (TLV:IDIN) dips a further 12% this week, earnings continue to decline

We think intelligent long term investing is the way to go. But that doesn't mean long term investors can avoid big losses. For example, after five long years the I.D.I. Insurance Company Ltd. (TLV:IDIN) share price is a whole 65% lower. We certainly feel for shareholders who bought near the top. And some of the more recent buyers are probably worried, too, with the stock falling 28% in the last year. Furthermore, it's down 23% in about a quarter. That's not much fun for holders. But this could be related to the weak market, which is down 12% in the same period.
With the stock having lost 12% in the past week, it's worth taking a look at business performance and seeing if there's any red flags.
Our analysis indicates that IDIN is potentially undervalued!
While the efficient markets hypothesis continues to be taught by some, it has been proven that markets are over-reactive dynamic systems, and investors are not always rational. One way to examine how market sentiment has changed over time is to look at the interaction between a company's share price and its earnings per share (EPS).
Looking back five years, both I.D.I. Insurance's share price and EPS declined; the latter at a rate of 3.9% per year. Readers should note that the share price has fallen faster than the EPS, at a rate of 19% per year, over the period. So it seems the market was too confident about the business, in the past. The less favorable sentiment is reflected in its current P/E ratio of 9.72.
The company's earnings per share (over time) is depicted in the image below (click to see the exact numbers).
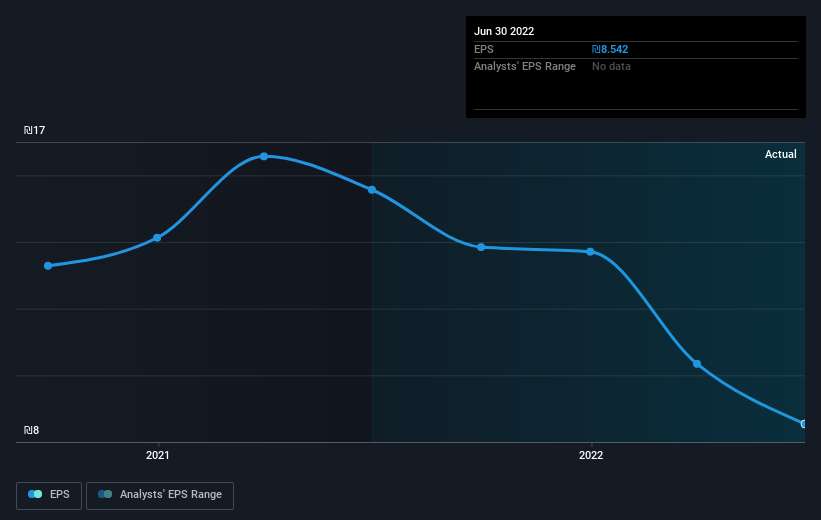
Dive deeper into I.D.I. Insurance's key metrics by checking this interactive graph of I.D.I. Insurance's earnings, revenue and cash flow.
What About Dividends?
When looking at investment returns, it is important to consider the difference between total shareholder return (TSR) and share price return. Whereas the share price return only reflects the change in the share price, the TSR includes the value of dividends (assuming they were reinvested) and the benefit of any discounted capital raising or spin-off. So for companies that pay a generous dividend, the TSR is often a lot higher than the share price return. We note that for I.D.I. Insurance the TSR over the last 5 years was -53%, which is better than the share price return mentioned above. And there's no prize for guessing that the dividend payments largely explain the divergence!
A Different Perspective
We regret to report that I.D.I. Insurance shareholders are down 26% for the year (even including dividends). Unfortunately, that's worse than the broader market decline of 6.9%. However, it could simply be that the share price has been impacted by broader market jitters. It might be worth keeping an eye on the fundamentals, in case there's a good opportunity. Regrettably, last year's performance caps off a bad run, with the shareholders facing a total loss of 9% per year over five years. Generally speaking long term share price weakness can be a bad sign, though contrarian investors might want to research the stock in hope of a turnaround. It's always interesting to track share price performance over the longer term. But to understand I.D.I. Insurance better, we need to consider many other factors. For instance, we've identified 4 warning signs for I.D.I. Insurance (1 shouldn't be ignored) that you should be aware of.
If you would prefer to check out another company -- one with potentially superior financials -- then do not miss this free list of companies that have proven they can grow earnings.
Please note, the market returns quoted in this article reflect the market weighted average returns of stocks that currently trade on IL exchanges.
New: AI Stock Screener & Alerts
Our new AI Stock Screener scans the market every day to uncover opportunities.
• Dividend Powerhouses (3%+ Yield)
• Undervalued Small Caps with Insider Buying
• High growth Tech and AI Companies
Or build your own from over 50 metrics.
Have feedback on this article? Concerned about the content? Get in touch with us directly. Alternatively, email editorial-team (at) simplywallst.com.
This article by Simply Wall St is general in nature. We provide commentary based on historical data and analyst forecasts only using an unbiased methodology and our articles are not intended to be financial advice. It does not constitute a recommendation to buy or sell any stock, and does not take account of your objectives, or your financial situation. We aim to bring you long-term focused analysis driven by fundamental data. Note that our analysis may not factor in the latest price-sensitive company announcements or qualitative material. Simply Wall St has no position in any stocks mentioned.
About TASE:IDIN
I.D.I. Insurance
Provides insurance products and services to individuals and corporate customers in Israel.
Solid track record with excellent balance sheet.
Market Insights

Advertisement
Community Narratives
WhiteCap Is Positioned To Profit Regardless Of Trump's Policy 
Fair Value CA$22.60|61.7% undervalued
ST
Equity Analyst and Writer
Microsoft's Evolution Will Drive Revenue to New Heights Fueled by AI
Fair Value US$360.00|28.9% overvalued
BR
Community Contributor
A CASE FOR USD$2.50 (CAD$3.44) BY 2028 (A 5-10 BAGGER)
Fair Value CA$3.44|88.1% undervalued
AG
Community Contributor