- Israel
- /
- Oil and Gas
- /
- TASE:UPSL
Investors Give Upsellon Brands Holdings Ltd (TLV:UPSL) Shares A 29% Hiding

Unfortunately for some shareholders, the Upsellon Brands Holdings Ltd (TLV:UPSL) share price has dived 29% in the last thirty days, prolonging recent pain. For any long-term shareholders, the last month ends a year to forget by locking in a 89% share price decline.
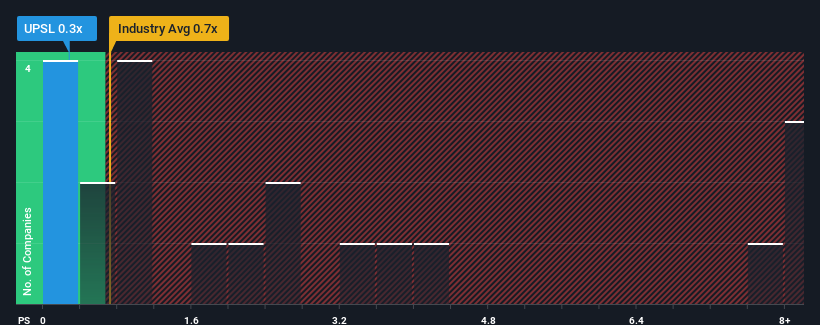
Since its price has dipped substantially, Upsellon Brands Holdings may be sending bullish signals at the moment with its price-to-sales (or "P/S") ratio of 0.3x, since almost half of all companies in the Oil and Gas industry in Israel have P/S ratios greater than 1.2x and even P/S higher than 4x are not unusual. However, the P/S might be low for a reason and it requires further investigation to determine if it's justified.
View our latest analysis for Upsellon Brands Holdings

What Does Upsellon Brands Holdings' Recent Performance Look Like?
Upsellon Brands Holdings certainly has been doing a great job lately as it's been growing its revenue at a really rapid pace. One possibility is that the P/S ratio is low because investors think this strong revenue growth might actually underperform the broader industry in the near future. If you like the company, you'd be hoping this isn't the case so that you could potentially pick up some stock while it's out of favour.
Although there are no analyst estimates available for Upsellon Brands Holdings, take a look at this free data-rich visualisation to see how the company stacks up on earnings, revenue and cash flow.Is There Any Revenue Growth Forecasted For Upsellon Brands Holdings?
In order to justify its P/S ratio, Upsellon Brands Holdings would need to produce sluggish growth that's trailing the industry.
Retrospectively, the last year delivered an exceptional 49% gain to the company's top line. However, the latest three year period hasn't been as great in aggregate as it didn't manage to provide any growth at all. Accordingly, shareholders probably wouldn't have been overly satisfied with the unstable medium-term growth rates.
Weighing the recent medium-term upward revenue trajectory against the broader industry's one-year forecast for contraction of 10% shows it's a great look while it lasts.
With this information, we find it very odd that Upsellon Brands Holdings is trading at a P/S lower than the industry. It looks like most investors are not convinced at all that the company can maintain its recent positive growth rate in the face of a shrinking broader industry.
What We Can Learn From Upsellon Brands Holdings' P/S?
Upsellon Brands Holdings' recently weak share price has pulled its P/S back below other Oil and Gas companies. While the price-to-sales ratio shouldn't be the defining factor in whether you buy a stock or not, it's quite a capable barometer of revenue expectations.
Our examination of Upsellon Brands Holdings revealed that despite growing revenue over the medium-term in a shrinking industry, the P/S doesn't reflect this as it's lower than the industry average. There could be some major unobserved threats to revenue preventing the P/S ratio from matching this positive performance. Amidst challenging industry conditions, perhaps a key concern is whether the company can sustain its superior revenue growth trajectory. While the chance of the share price dropping sharply is fairly remote, investors do seem to be anticipating future revenue instability.
Plus, you should also learn about these 5 warning signs we've spotted with Upsellon Brands Holdings.
If you're unsure about the strength of Upsellon Brands Holdings' business, why not explore our interactive list of stocks with solid business fundamentals for some other companies you may have missed.
New: AI Stock Screener & Alerts
Our new AI Stock Screener scans the market every day to uncover opportunities.
• Dividend Powerhouses (3%+ Yield)
• Undervalued Small Caps with Insider Buying
• High growth Tech and AI Companies
Or build your own from over 50 metrics.
Have feedback on this article? Concerned about the content? Get in touch with us directly. Alternatively, email editorial-team (at) simplywallst.com.
This article by Simply Wall St is general in nature. We provide commentary based on historical data and analyst forecasts only using an unbiased methodology and our articles are not intended to be financial advice. It does not constitute a recommendation to buy or sell any stock, and does not take account of your objectives, or your financial situation. We aim to bring you long-term focused analysis driven by fundamental data. Note that our analysis may not factor in the latest price-sensitive company announcements or qualitative material. Simply Wall St has no position in any stocks mentioned.
About TASE:UPSL
Upsellon Brands Holdings
Engages in acquisition, marketing, and improvement of private labels, products, and virtual stores that operate under amazon's trading platform.
Excellent balance sheet and good value.
Market Insights
Community Narratives


