
Advertisement
- Israel
- /
- Capital Markets
- /
- TASE:MRIN
Shareholders Of Y.D. More Investments (TLV:MRIN) Must Be Happy With Their 223% Total Return
It might seem bad, but the worst that can happen when you buy a stock (without leverage) is that its share price goes to zero. But in contrast you can make much more than 100% if the company does well. For instance the Y.D. More Investments Ltd (TLV:MRIN) share price is 149% higher than it was three years ago. Most would be happy with that. Also pleasing for shareholders was the 11% gain in the last three months. But this could be related to the strong market, which is up 7.3% in the last three months.
View our latest analysis for Y.D. More Investments
To quote Buffett, 'Ships will sail around the world but the Flat Earth Society will flourish. There will continue to be wide discrepancies between price and value in the marketplace...' One way to examine how market sentiment has changed over time is to look at the interaction between a company's share price and its earnings per share (EPS).
Over the last three years, Y.D. More Investments failed to grow earnings per share, which fell 2.5% (annualized).
Given the share price resilience, we don't think the (declining) EPS numbers are a good measure of how the business is moving forward, right now. Since the change in EPS doesn't seem to correlate with the change in share price, it's worth taking a look at other metrics.
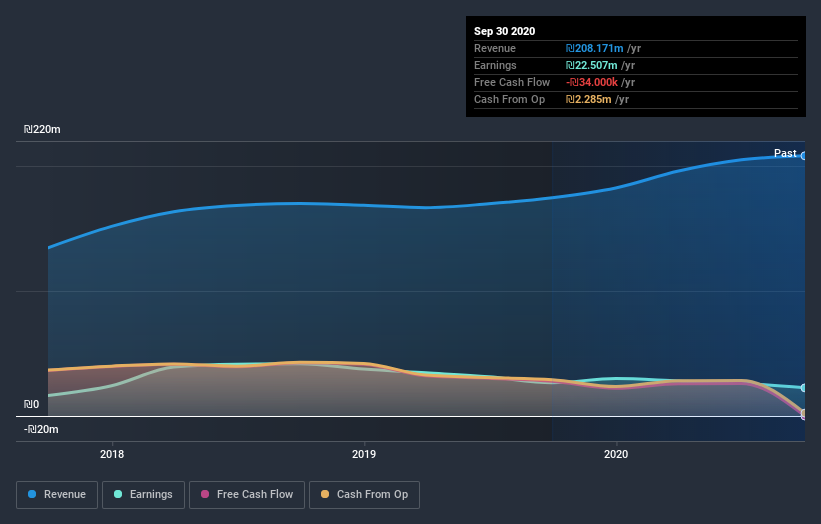
It may well be that Y.D. More Investments revenue growth rate of 11% over three years has convinced shareholders to believe in a brighter future. In that case, the company may be sacrificing current earnings per share to drive growth, and maybe shareholder's faith in better days ahead will be rewarded.
The graphic below depicts how earnings and revenue have changed over time (unveil the exact values by clicking on the image).
You can see how its balance sheet has strengthened (or weakened) over time in this free interactive graphic.
What About Dividends?
When looking at investment returns, it is important to consider the difference between total shareholder return (TSR) and share price return. The TSR is a return calculation that accounts for the value of cash dividends (assuming that any dividend received was reinvested) and the calculated value of any discounted capital raisings and spin-offs. Arguably, the TSR gives a more comprehensive picture of the return generated by a stock. We note that for Y.D. More Investments the TSR over the last 3 years was 223%, which is better than the share price return mentioned above. And there's no prize for guessing that the dividend payments largely explain the divergence!
A Different Perspective
It's nice to see that Y.D. More Investments shareholders have gained 43% (in total) over the last year. That includes the value of the dividend. The TSR has been even better over three years, coming in at 48% per year. It's always interesting to track share price performance over the longer term. But to understand Y.D. More Investments better, we need to consider many other factors. Take risks, for example - Y.D. More Investments has 4 warning signs (and 2 which make us uncomfortable) we think you should know about.
If you like to buy stocks alongside management, then you might just love this free list of companies. (Hint: insiders have been buying them).
Please note, the market returns quoted in this article reflect the market weighted average returns of stocks that currently trade on IL exchanges.
If you decide to trade Y.D. More Investments, use the lowest-cost* platform that is rated #1 Overall by Barron’s, Interactive Brokers. Trade stocks, options, futures, forex, bonds and funds on 135 markets, all from a single integrated account. Promoted
New: Manage All Your Stock Portfolios in One Place
We've created the ultimate portfolio companion for stock investors, and it's free.
• Connect an unlimited number of Portfolios and see your total in one currency
• Be alerted to new Warning Signs or Risks via email or mobile
• Track the Fair Value of your stocks
This article by Simply Wall St is general in nature. It does not constitute a recommendation to buy or sell any stock, and does not take account of your objectives, or your financial situation. We aim to bring you long-term focused analysis driven by fundamental data. Note that our analysis may not factor in the latest price-sensitive company announcements or qualitative material. Simply Wall St has no position in any stocks mentioned.
*Interactive Brokers Rated Lowest Cost Broker by StockBrokers.com Annual Online Review 2020
Have feedback on this article? Concerned about the content? Get in touch with us directly. Alternatively, email editorial-team (at) simplywallst.com.
About TASE:MRIN
Outstanding track record with flawless balance sheet.
Market Insights

Advertisement
Weekly Picks
RO


RockeTeller on Santacruz Silver Mining ·
Crazy Undervalued 42 Baggers Silver Play (Active & Running Mine)
Fair Value:CA$8696.4% undervalued
38 followersusers have followed this narrative
6 commentsusers have commented on this narrative
10 likesusers have liked this narrative
RO


Robbo on Fiducian Group ·
Fiducian: Compliance Clouds or Value Opportunity?
Fair Value:AU$126.1% undervalued
4 followersusers have followed this narrative
0 commentsusers have commented on this narrative
0 likesusers have liked this narrative
WO

woodworthfund on Willamette Valley Vineyards ·
Willamette Valley Vineyards (WVVI): Not-So-Great Value
Fair Value:US$244.5% overvalued
6 followersusers have followed this narrative
0 commentsusers have commented on this narrative
1 likeusers have liked this narrative
Recently Updated Narratives
FU

FundamentallySarcastic on Credit Corp Group ·
Moderation and Stabilisation: HOLD: Fair Price based on a 4-year Cycle is $12.08
Fair Value:AU$12.6411.4% overvalued
1 followerusers have followed this narrative
0 commentsusers have commented on this narrative
0 likesusers have liked this narrative
MA


MarkoVT on Alphabet ·
Positioned globally, partnered locally
Fair Value:US$390.1918.1% undervalued
2 followersusers have followed this narrative
0 commentsusers have commented on this narrative
0 likesusers have liked this narrative
JO


JohnJ on Worldline ·
When will fraudsters be investigated in depth. Fraud was ongoing in France too.
Fair Value:€0.5190.0% overvalued
1 followerusers have followed this narrative
0 commentsusers have commented on this narrative
0 likesusers have liked this narrative
Popular Narratives
TH


TheWallstreetKing on MicroVision ·
MicroVision will explode future revenue by 380.37% with a vision towards success
Fair Value:US$6098.5% undervalued
114 followersusers have followed this narrative
11 commentsusers have commented on this narrative
22 likesusers have liked this narrative
AN


AnalystConsensusTarget on NVIDIA ·
NVDA: Expanding AI Demand Will Drive Major Data Center Investments Through 2026
Fair Value:US$250.3928.3% undervalued
952 followersusers have followed this narrative
6 commentsusers have commented on this narrative
25 likesusers have liked this narrative
OS

oscargarcia on Alphabet ·
The company that turned a verb into a global necessity and basically runs the modern internet, digital ads, smartphones, maps, and AI.
Fair Value:US$3406.0% undervalued
148 followersusers have followed this narrative
6 commentsusers have commented on this narrative
18 likesusers have liked this narrative

