
Advertisement
- Israel
- /
- Food and Staples Retail
- /
- TASE:HMAM
Returns At Hamama Meir Trading (1996) (TLV:HMAM) Are On The Way Up
To find a multi-bagger stock, what are the underlying trends we should look for in a business? Firstly, we'd want to identify a growing return on capital employed (ROCE) and then alongside that, an ever-increasing base of capital employed. Put simply, these types of businesses are compounding machines, meaning they are continually reinvesting their earnings at ever-higher rates of return. So when we looked at Hamama Meir Trading (1996) (TLV:HMAM) and its trend of ROCE, we really liked what we saw.
What Is Return On Capital Employed (ROCE)?
For those who don't know, ROCE is a measure of a company's yearly pre-tax profit (its return), relative to the capital employed in the business. Analysts use this formula to calculate it for Hamama Meir Trading (1996):
Return on Capital Employed = Earnings Before Interest and Tax (EBIT) ÷ (Total Assets - Current Liabilities)
0.11 = ₪12m ÷ (₪175m - ₪64m) (Based on the trailing twelve months to June 2025).
So, Hamama Meir Trading (1996) has an ROCE of 11%. That's a pretty standard return and it's in line with the industry average of 11%.
View our latest analysis for Hamama Meir Trading (1996)
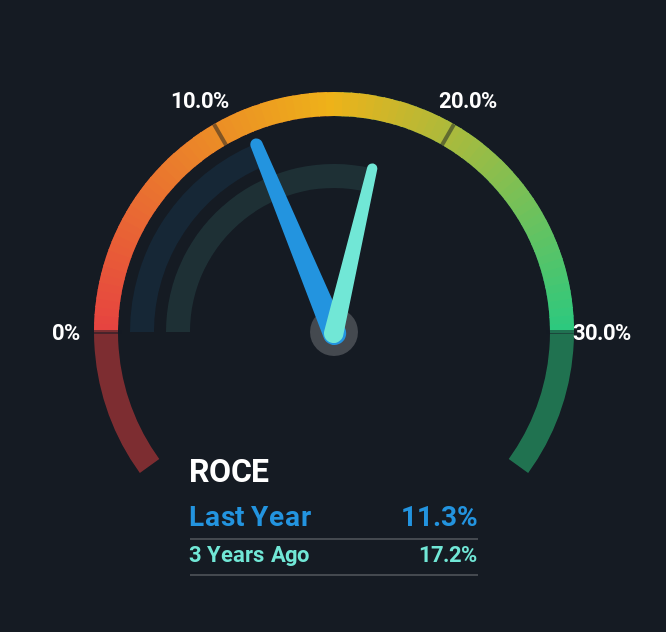
Historical performance is a great place to start when researching a stock so above you can see the gauge for Hamama Meir Trading (1996)'s ROCE against it's prior returns. If you want to delve into the historical earnings , check out these free graphs detailing revenue and cash flow performance of Hamama Meir Trading (1996).
What The Trend Of ROCE Can Tell Us
Investors would be pleased with what's happening at Hamama Meir Trading (1996). The numbers show that in the last five years, the returns generated on capital employed have grown considerably to 11%. The amount of capital employed has increased too, by 31%. This can indicate that there's plenty of opportunities to invest capital internally and at ever higher rates, a combination that's common among multi-baggers.
On a related note, the company's ratio of current liabilities to total assets has decreased to 37%, which basically reduces it's funding from the likes of short-term creditors or suppliers. This tells us that Hamama Meir Trading (1996) has grown its returns without a reliance on increasing their current liabilities, which we're very happy with.
The Bottom Line
All in all, it's terrific to see that Hamama Meir Trading (1996) is reaping the rewards from prior investments and is growing its capital base. Since the stock has returned a staggering 192% to shareholders over the last five years, it looks like investors are recognizing these changes. So given the stock has proven it has promising trends, it's worth researching the company further to see if these trends are likely to persist.
If you want to know some of the risks facing Hamama Meir Trading (1996) we've found 2 warning signs (1 is a bit concerning!) that you should be aware of before investing here.
While Hamama Meir Trading (1996) may not currently earn the highest returns, we've compiled a list of companies that currently earn more than 25% return on equity. Check out this free list here.
Valuation is complex, but we're here to simplify it.
Discover if Hamama Meir Trading (1996) might be undervalued or overvalued with our detailed analysis, featuring fair value estimates, potential risks, dividends, insider trades, and its financial condition.
Access Free AnalysisHave feedback on this article? Concerned about the content? Get in touch with us directly. Alternatively, email editorial-team (at) simplywallst.com.
This article by Simply Wall St is general in nature. We provide commentary based on historical data and analyst forecasts only using an unbiased methodology and our articles are not intended to be financial advice. It does not constitute a recommendation to buy or sell any stock, and does not take account of your objectives, or your financial situation. We aim to bring you long-term focused analysis driven by fundamental data. Note that our analysis may not factor in the latest price-sensitive company announcements or qualitative material. Simply Wall St has no position in any stocks mentioned.
About TASE:HMAM
Hamama Meir Trading (1996)
Engages in the import and distribution of raw materials for the food industry in Israel.
Flawless balance sheet with solid track record.
Market Insights

Advertisement
Weekly Picks
RO


RockeTeller on Santacruz Silver Mining ·
Crazy Undervalued 42 Baggers Silver Play (Active & Running Mine)
Fair Value:CA$8696.7% undervalued
10 followersusers have followed this narrative
5 commentsusers have commented on this narrative
1 likeusers have liked this narrative
RO


Robbo on Fiducian Group ·
Fiducian: Compliance Clouds or Value Opportunity?
Fair Value:AU$126.3% undervalued
1 followerusers have followed this narrative
0 commentsusers have commented on this narrative
0 likesusers have liked this narrative
WO

woodworthfund on Willamette Valley Vineyards ·
Willamette Valley Vineyards (WVVI): Not-So-Great Value
Fair Value:US$242.5% overvalued
2 followersusers have followed this narrative
0 commentsusers have commented on this narrative
1 likeusers have liked this narrative
Recently Updated Narratives
YE
Yellow_fever on China Starch Holdings ·
China Starch Holdings eyes a revenue growth of 4.66% with a 5-year strategic plan
Fair Value:HK$0.562.8% undervalued
1 followerusers have followed this narrative
0 commentsusers have commented on this narrative
0 likesusers have liked this narrative
CO

composite32 on Power Solutions International ·
PSIX The timing of insider sales is a serious question mark
Fair Value:US$37.3845.7% overvalued
1 followerusers have followed this narrative
0 commentsusers have commented on this narrative
0 likesusers have liked this narrative
TA


Talos on Marvell Technology ·
The Great Strategy Swap – Selling "Old Auto" to Buy "Future Light"
Fair Value:US$155.3740.2% undervalued
1 followerusers have followed this narrative
0 commentsusers have commented on this narrative
0 likesusers have liked this narrative
Popular Narratives
TH


TheWallstreetKing on MicroVision ·
MicroVision will explode future revenue by 380.37% with a vision towards success
Fair Value:US$6098.6% undervalued
112 followersusers have followed this narrative
11 commentsusers have commented on this narrative
22 likesusers have liked this narrative
AN


AnalystConsensusTarget on NVIDIA ·
NVDA: Expanding AI Demand Will Drive Major Data Center Investments Through 2026
Fair Value:US$250.3927.6% undervalued
947 followersusers have followed this narrative
6 commentsusers have commented on this narrative
24 likesusers have liked this narrative
OS


oscargarcia on Alphabet ·
The company that turned a verb into a global necessity and basically runs the modern internet, digital ads, smartphones, maps, and AI.
Fair Value:US$3407.2% undervalued
148 followersusers have followed this narrative
6 commentsusers have commented on this narrative
18 likesusers have liked this narrative
