- Hong Kong
- /
- Gas Utilities
- /
- SEHK:8007
Not Many Are Piling Into Global Strategic Group Limited (HKG:8007) Stock Yet As It Plummets 26%

Global Strategic Group Limited (HKG:8007) shares have had a horrible month, losing 26% after a relatively good period beforehand. For any long-term shareholders, the last month ends a year to forget by locking in a 76% share price decline.
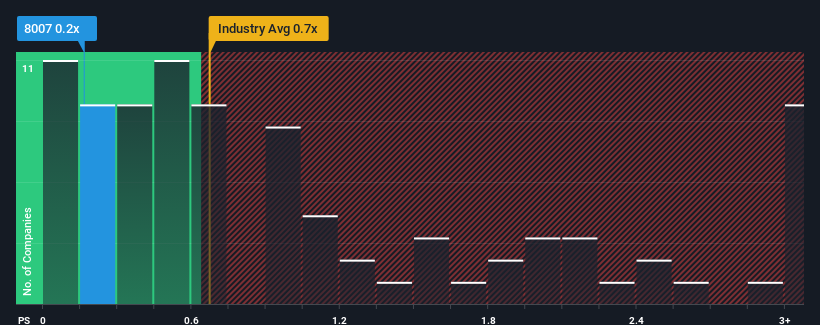
Even after such a large drop in price, there still wouldn't be many who think Global Strategic Group's price-to-sales (or "P/S") ratio of 0.2x is worth a mention when the median P/S in Hong Kong's Gas Utilities industry is similar at about 0.4x. However, investors might be overlooking a clear opportunity or potential setback if there is no rational basis for the P/S.
View our latest analysis for Global Strategic Group
What Does Global Strategic Group's P/S Mean For Shareholders?
Revenue has risen firmly for Global Strategic Group recently, which is pleasing to see. It might be that many expect the respectable revenue performance to wane, which has kept the P/S from rising. Those who are bullish on Global Strategic Group will be hoping that this isn't the case, so that they can pick up the stock at a lower valuation.
Want the full picture on earnings, revenue and cash flow for the company? Then our free report on Global Strategic Group will help you shine a light on its historical performance.Is There Some Revenue Growth Forecasted For Global Strategic Group?
Global Strategic Group's P/S ratio would be typical for a company that's only expected to deliver moderate growth, and importantly, perform in line with the industry.
If we review the last year of revenue growth, the company posted a terrific increase of 22%. The latest three year period has also seen an excellent 289% overall rise in revenue, aided by its short-term performance. So we can start by confirming that the company has done a great job of growing revenue over that time.
Comparing that to the industry, which is only predicted to deliver 4.0% growth in the next 12 months, the company's momentum is stronger based on recent medium-term annualised revenue results.
In light of this, it's curious that Global Strategic Group's P/S sits in line with the majority of other companies. Apparently some shareholders believe the recent performance is at its limits and have been accepting lower selling prices.
What Does Global Strategic Group's P/S Mean For Investors?
With its share price dropping off a cliff, the P/S for Global Strategic Group looks to be in line with the rest of the Gas Utilities industry. We'd say the price-to-sales ratio's power isn't primarily as a valuation instrument but rather to gauge current investor sentiment and future expectations.
We've established that Global Strategic Group currently trades on a lower than expected P/S since its recent three-year growth is higher than the wider industry forecast. When we see strong revenue with faster-than-industry growth, we can only assume potential risks are what might be placing pressure on the P/S ratio. It appears some are indeed anticipating revenue instability, because the persistence of these recent medium-term conditions would normally provide a boost to the share price.
Plus, you should also learn about these 3 warning signs we've spotted with Global Strategic Group (including 1 which shouldn't be ignored).
If these risks are making you reconsider your opinion on Global Strategic Group, explore our interactive list of high quality stocks to get an idea of what else is out there.
The New Payments ETF Is Live on NASDAQ:
Money is moving to real-time rails, and a newly listed ETF now gives investors direct exposure. Fast settlement. Institutional custody. Simple access.
Explore how this launch could reshape portfolios
Sponsored ContentNew: Manage All Your Stock Portfolios in One Place
We've created the ultimate portfolio companion for stock investors, and it's free.
• Connect an unlimited number of Portfolios and see your total in one currency
• Be alerted to new Warning Signs or Risks via email or mobile
• Track the Fair Value of your stocks
Have feedback on this article? Concerned about the content? Get in touch with us directly. Alternatively, email editorial-team (at) simplywallst.com.
This article by Simply Wall St is general in nature. We provide commentary based on historical data and analyst forecasts only using an unbiased methodology and our articles are not intended to be financial advice. It does not constitute a recommendation to buy or sell any stock, and does not take account of your objectives, or your financial situation. We aim to bring you long-term focused analysis driven by fundamental data. Note that our analysis may not factor in the latest price-sensitive company announcements or qualitative material. Simply Wall St has no position in any stocks mentioned.
About SEHK:8007
Global Strategic Group
An investment holding company, supplies natural gas in the People’s Republic of China.
Low risk and slightly overvalued.
Market Insights

Weekly Picks

THE KINGDOM OF BROWN GOODS: WHY MGPI IS BEING CRUSHED BY INVENTORY & PRIMED FOR RESURRECTION


Why Vertical Aerospace (NYSE: EVTL) is Worth Possibly Over 13x its Current Price


The Quiet Giant That Became AI’s Power Grid
Recently Updated Narratives

Deep Value Multi Bagger Opportunity


A case for CA$31.80 (undiluted), aka 8,616% upside from CA$0.37 (an 86 bagger!).


Unicycive Therapeutics (Nasdaq: UNCY) – Preparing for a Second Shot at Bringing a New Kidney Treatment to Market (TEST)
Popular Narratives


MicroVision will explode future revenue by 380.37% with a vision towards success


NVDA: Expanding AI Demand Will Drive Major Data Center Investments Through 2026


Crazy Undervalued 42 Baggers Silver Play (Active & Running Mine)
Trending Discussion


