
Advertisement
- Hong Kong
- /
- Electric Utilities
- /
- SEHK:1671
Market Might Still Lack Some Conviction On Tianjin Tianbao Energy Co., Ltd. (HKG:1671) Even After 26% Share Price Boost
Tianjin Tianbao Energy Co., Ltd. (HKG:1671) shares have had a really impressive month, gaining 26% after a shaky period beforehand. Notwithstanding the latest gain, the annual share price return of 5.9% isn't as impressive.
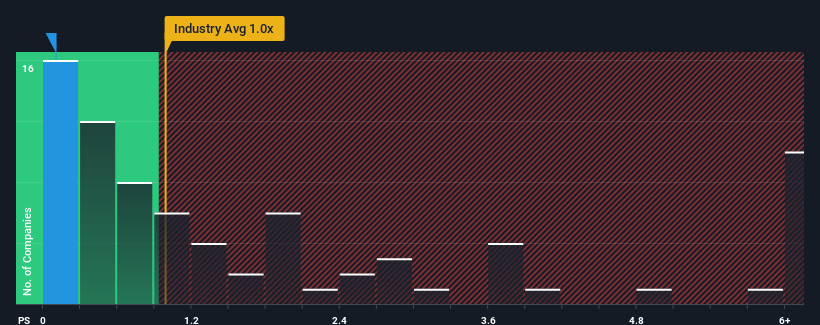
Even after such a large jump in price, Tianjin Tianbao Energy may still look like a strong buying opportunity at present with its price-to-sales (or "P/S") ratio of 0.1x, considering almost half of all companies in the Electric Utilities industry in Hong Kong have P/S ratios greater than 2.8x and even P/S higher than 15x aren't out of the ordinary. However, the P/S might be quite low for a reason and it requires further investigation to determine if it's justified.
View our latest analysis for Tianjin Tianbao Energy
How Has Tianjin Tianbao Energy Performed Recently?
The revenue growth achieved at Tianjin Tianbao Energy over the last year would be more than acceptable for most companies. It might be that many expect the respectable revenue performance to degrade substantially, which has repressed the P/S. If you like the company, you'd be hoping this isn't the case so that you could potentially pick up some stock while it's out of favour.
We don't have analyst forecasts, but you can see how recent trends are setting up the company for the future by checking out our free report on Tianjin Tianbao Energy's earnings, revenue and cash flow.Is There Any Revenue Growth Forecasted For Tianjin Tianbao Energy?
In order to justify its P/S ratio, Tianjin Tianbao Energy would need to produce anemic growth that's substantially trailing the industry.
If we review the last year of revenue growth, the company posted a worthy increase of 10%. Pleasingly, revenue has also lifted 63% in aggregate from three years ago, partly thanks to the last 12 months of growth. Accordingly, shareholders would have definitely welcomed those medium-term rates of revenue growth.
Comparing that recent medium-term revenue trajectory with the industry's one-year growth forecast of 4.5% shows it's noticeably more attractive.
With this information, we find it odd that Tianjin Tianbao Energy is trading at a P/S lower than the industry. It looks like most investors are not convinced the company can maintain its recent growth rates.
The Key Takeaway
Even after such a strong price move, Tianjin Tianbao Energy's P/S still trails the rest of the industry. Using the price-to-sales ratio alone to determine if you should sell your stock isn't sensible, however it can be a practical guide to the company's future prospects.
We're very surprised to see Tianjin Tianbao Energy currently trading on a much lower than expected P/S since its recent three-year growth is higher than the wider industry forecast. When we see robust revenue growth that outpaces the industry, we presume that there are notable underlying risks to the company's future performance, which is exerting downward pressure on the P/S ratio. It appears many are indeed anticipating revenue instability, because the persistence of these recent medium-term conditions would normally provide a boost to the share price.
Don't forget that there may be other risks. For instance, we've identified 4 warning signs for Tianjin Tianbao Energy (2 don't sit too well with us) you should be aware of.
If strong companies turning a profit tickle your fancy, then you'll want to check out this free list of interesting companies that trade on a low P/E (but have proven they can grow earnings).
Valuation is complex, but we're here to simplify it.
Discover if Tianjin Tianbao Energy might be undervalued or overvalued with our detailed analysis, featuring fair value estimates, potential risks, dividends, insider trades, and its financial condition.
Access Free AnalysisHave feedback on this article? Concerned about the content? Get in touch with us directly. Alternatively, email editorial-team (at) simplywallst.com.
This article by Simply Wall St is general in nature. We provide commentary based on historical data and analyst forecasts only using an unbiased methodology and our articles are not intended to be financial advice. It does not constitute a recommendation to buy or sell any stock, and does not take account of your objectives, or your financial situation. We aim to bring you long-term focused analysis driven by fundamental data. Note that our analysis may not factor in the latest price-sensitive company announcements or qualitative material. Simply Wall St has no position in any stocks mentioned.
About SEHK:1671
Tianjin Tianbao Energy
Generates and supplies power in the People's Republic of China.
Proven track record with mediocre balance sheet.
Market Insights

Advertisement
Community Narratives
A formidable player in AI and enterprise computing.
Fair Value US$210.00|3.9% overvalued
CO
Community Contributor
IREN's Bold Moves in Sustainable Bitcoin Mining & AI Data Centers
Fair Value US$89.00|21.8% undervalued
BL
Community Contributor
Cooling the Champions: The Aussie Tech Behind F1's Victories
Fair Value AU$12.40|40.6% undervalued
TR
Community Contributor