
Advertisement
- Hong Kong
- /
- Renewable Energy
- /
- SEHK:1071
Huadian Power International's (HKG:1071) investors will be pleased with their impressive 186% return over the last five years
Stock pickers are generally looking for stocks that will outperform the broader market. And while active stock picking involves risks (and requires diversification) it can also provide excess returns. For example, long term Huadian Power International Corporation Limited (HKG:1071) shareholders have enjoyed a 89% share price rise over the last half decade, well in excess of the market return of around 13% (not including dividends). However, more recent returns haven't been as impressive as that, with the stock returning just 2.9% in the last year, including dividends.
With that in mind, it's worth seeing if the company's underlying fundamentals have been the driver of long term performance, or if there are some discrepancies.
While the efficient markets hypothesis continues to be taught by some, it has been proven that markets are over-reactive dynamic systems, and investors are not always rational. One flawed but reasonable way to assess how sentiment around a company has changed is to compare the earnings per share (EPS) with the share price.
During the five years of share price growth, Huadian Power International moved from a loss to profitability. That's generally thought to be a genuine positive, so investors may expect to see an increasing share price.
The image below shows how EPS has tracked over time (if you click on the image you can see greater detail).
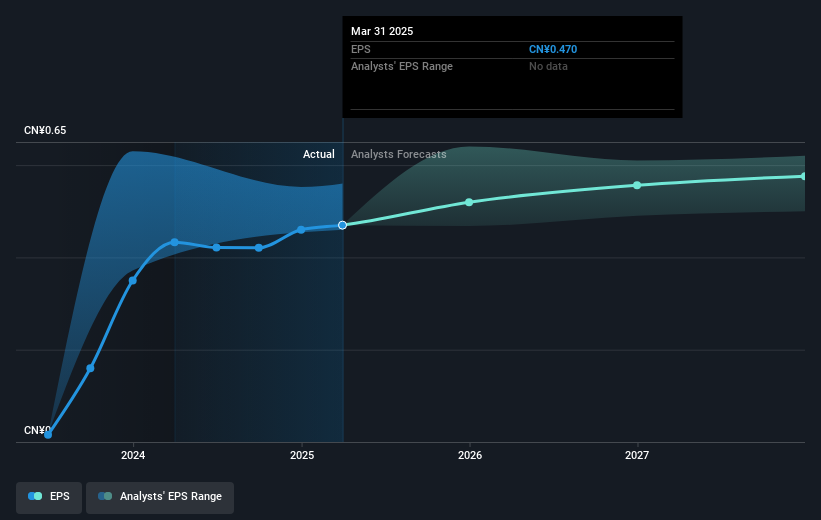
We know that Huadian Power International has improved its bottom line over the last three years, but what does the future have in store? It might be well worthwhile taking a look at our free report on how its financial position has changed over time.
What About Dividends?
When looking at investment returns, it is important to consider the difference between total shareholder return (TSR) and share price return. Whereas the share price return only reflects the change in the share price, the TSR includes the value of dividends (assuming they were reinvested) and the benefit of any discounted capital raising or spin-off. It's fair to say that the TSR gives a more complete picture for stocks that pay a dividend. As it happens, Huadian Power International's TSR for the last 5 years was 186%, which exceeds the share price return mentioned earlier. And there's no prize for guessing that the dividend payments largely explain the divergence!
A Different Perspective
Huadian Power International shareholders gained a total return of 2.9% during the year. But that return falls short of the market. If we look back over five years, the returns are even better, coming in at 23% per year for five years. It may well be that this is a business worth popping on the watching, given the continuing positive reception, over time, from the market. It's always interesting to track share price performance over the longer term. But to understand Huadian Power International better, we need to consider many other factors. Take risks, for example - Huadian Power International has 2 warning signs (and 1 which is a bit concerning) we think you should know about.
Of course Huadian Power International may not be the best stock to buy. So you may wish to see this free collection of growth stocks.
Please note, the market returns quoted in this article reflect the market weighted average returns of stocks that currently trade on Hong Kong exchanges.
Valuation is complex, but we're here to simplify it.
Discover if Huadian Power International might be undervalued or overvalued with our detailed analysis, featuring fair value estimates, potential risks, dividends, insider trades, and its financial condition.
Access Free AnalysisHave feedback on this article? Concerned about the content? Get in touch with us directly. Alternatively, email editorial-team (at) simplywallst.com.
This article by Simply Wall St is general in nature. We provide commentary based on historical data and analyst forecasts only using an unbiased methodology and our articles are not intended to be financial advice. It does not constitute a recommendation to buy or sell any stock, and does not take account of your objectives, or your financial situation. We aim to bring you long-term focused analysis driven by fundamental data. Note that our analysis may not factor in the latest price-sensitive company announcements or qualitative material. Simply Wall St has no position in any stocks mentioned.
About SEHK:1071
Huadian Power International
Engages in the generation and sale of electricity, heat, and coal to power grid companies in the People’s Republic of China.
Solid track record average dividend payer.
Market Insights

Advertisement
Community Narratives

Apple: A Dying Star with an Overpriced Valuation
Fair Value US$177.34|19.1% overvalued
IN
Community Contributor
Avino a case for USD$20 per share within 5 years (assuming $3,500 gold, $100 silver and $4 copper).
Fair Value CA$26.79|86.0% undervalued
AG
Community Contributor
Riding the Defense Boom RENK Sees Revenue Climb at 15% CAGR by FY 2029
Fair Value €69.87|14.3% undervalued
CH
Community Contributor