
Advertisement
- Hong Kong
- /
- Infrastructure
- /
- SEHK:3369
Qinhuangdao Port's (HKG:3369) 40% CAGR outpaced the company's earnings growth over the same three-year period
The most you can lose on any stock (assuming you don't use leverage) is 100% of your money. But in contrast you can make much more than 100% if the company does well. To wit, the Qinhuangdao Port Co., Ltd. (HKG:3369) share price has flown 138% in the last three years. How nice for those who held the stock! It's also good to see the share price up 17% over the last quarter. But this could be related to the strong market, which is up 12% in the last three months.
The past week has proven to be lucrative for Qinhuangdao Port investors, so let's see if fundamentals drove the company's three-year performance.
To quote Buffett, 'Ships will sail around the world but the Flat Earth Society will flourish. There will continue to be wide discrepancies between price and value in the marketplace...' One way to examine how market sentiment has changed over time is to look at the interaction between a company's share price and its earnings per share (EPS).
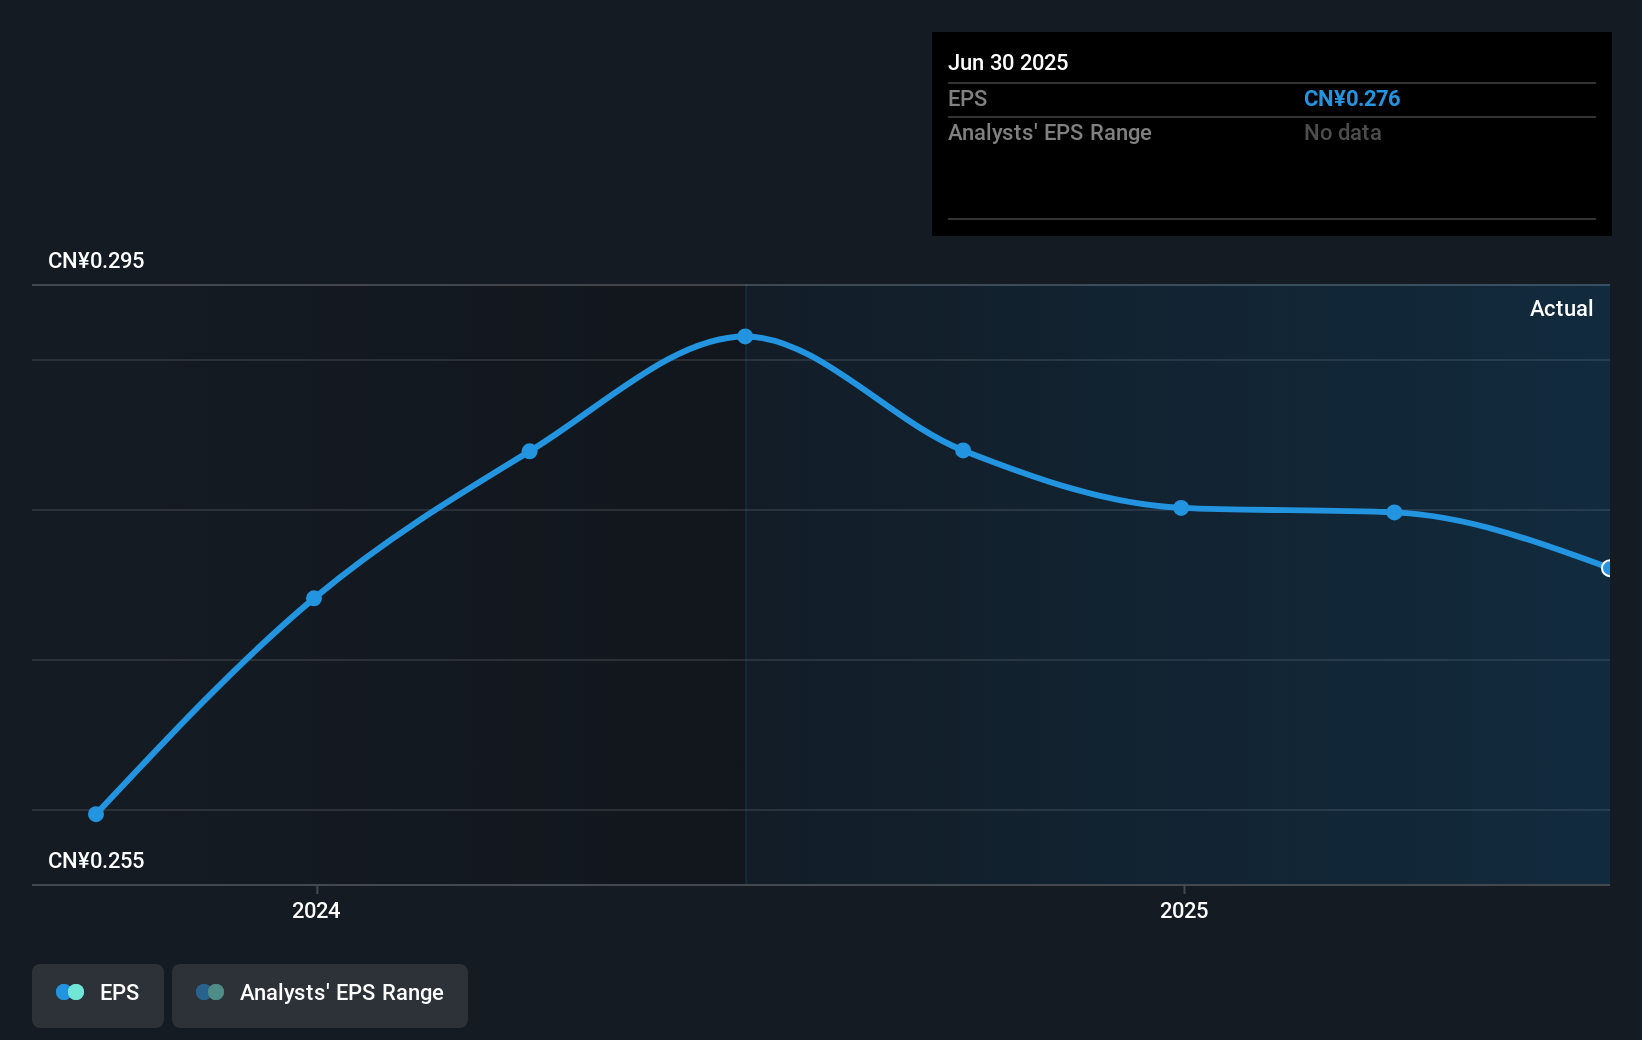
During three years of share price growth, Qinhuangdao Port achieved compound earnings per share growth of 14% per year. This EPS growth is lower than the 34% average annual increase in the share price. So it's fair to assume the market has a higher opinion of the business than it did three years ago. It is quite common to see investors become enamoured with a business, after a few years of solid progress.
The image below shows how EPS has tracked over time (if you click on the image you can see greater detail).
We're pleased to report that the CEO is remunerated more modestly than most CEOs at similarly capitalized companies. But while CEO remuneration is always worth checking, the really important question is whether the company can grow earnings going forward. Dive deeper into the earnings by checking this interactive graph of Qinhuangdao Port's earnings, revenue and cash flow.
What About Dividends?
It is important to consider the total shareholder return, as well as the share price return, for any given stock. Whereas the share price return only reflects the change in the share price, the TSR includes the value of dividends (assuming they were reinvested) and the benefit of any discounted capital raising or spin-off. It's fair to say that the TSR gives a more complete picture for stocks that pay a dividend. In the case of Qinhuangdao Port, it has a TSR of 176% for the last 3 years. That exceeds its share price return that we previously mentioned. And there's no prize for guessing that the dividend payments largely explain the divergence!
A Different Perspective
Qinhuangdao Port provided a TSR of 34% over the last twelve months. Unfortunately this falls short of the market return. On the bright side, that's still a gain, and it's actually better than the average return of 22% over half a decade It is possible that returns will improve along with the business fundamentals. It's always interesting to track share price performance over the longer term. But to understand Qinhuangdao Port better, we need to consider many other factors. Case in point: We've spotted 1 warning sign for Qinhuangdao Port you should be aware of.
If you like to buy stocks alongside management, then you might just love this free list of companies. (Hint: many of them are unnoticed AND have attractive valuation).
Please note, the market returns quoted in this article reflect the market weighted average returns of stocks that currently trade on Hong Kong exchanges.
Valuation is complex, but we're here to simplify it.
Discover if Qinhuangdao Port might be undervalued or overvalued with our detailed analysis, featuring fair value estimates, potential risks, dividends, insider trades, and its financial condition.
Access Free AnalysisHave feedback on this article? Concerned about the content? Get in touch with us directly. Alternatively, email editorial-team (at) simplywallst.com.
This article by Simply Wall St is general in nature. We provide commentary based on historical data and analyst forecasts only using an unbiased methodology and our articles are not intended to be financial advice. It does not constitute a recommendation to buy or sell any stock, and does not take account of your objectives, or your financial situation. We aim to bring you long-term focused analysis driven by fundamental data. Note that our analysis may not factor in the latest price-sensitive company announcements or qualitative material. Simply Wall St has no position in any stocks mentioned.
About SEHK:3369
Flawless balance sheet second-rate dividend payer.
Similar Companies
Market Insights

Advertisement
Community Narratives
The Next Phase of Energy Storage: How NeoVolta Is Tackling America’s Power Crunch
Fair Value US$7.50|30.4% undervalued
MA
Community Contributor
A formidable player in AI and enterprise computing.
Fair Value US$210.00|3.0% undervalued
CO
Community Contributor
IREN's Bold Moves in Sustainable Bitcoin Mining & AI Data Centers
Fair Value US$72.52|20.4% undervalued
BL
Community Contributor
Cooling the Champions: The Aussie Tech Behind F1's Victories
Fair Value AU$12.40|38.1% undervalued
TR
Community Contributor