- Hong Kong
- /
- Tech Hardware
- /
- SEHK:3315
Goldpac Group (HKG:3315) Is Finding It Tricky To Allocate Its Capital

If you're looking at a mature business that's past the growth phase, what are some of the underlying trends that pop up? More often than not, we'll see a declining return on capital employed (ROCE) and a declining amount of capital employed. This indicates to us that the business is not only shrinking the size of its net assets, but its returns are falling as well. So after glancing at the trends within Goldpac Group (HKG:3315), we weren't too hopeful.
Return On Capital Employed (ROCE): What Is It?
If you haven't worked with ROCE before, it measures the 'return' (pre-tax profit) a company generates from capital employed in its business. Analysts use this formula to calculate it for Goldpac Group:
Return on Capital Employed = Earnings Before Interest and Tax (EBIT) ÷ (Total Assets - Current Liabilities)
0.036 = CN¥76m ÷ (CN¥2.8b - CN¥707m) (Based on the trailing twelve months to December 2022).
Thus, Goldpac Group has an ROCE of 3.6%. On its own, that's a low figure but it's around the 3.3% average generated by the Tech industry.
Check out our latest analysis for Goldpac Group
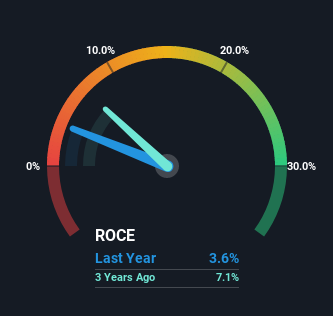
Historical performance is a great place to start when researching a stock so above you can see the gauge for Goldpac Group's ROCE against it's prior returns. If you'd like to look at how Goldpac Group has performed in the past in other metrics, you can view this free graph of past earnings, revenue and cash flow.
SWOT Analysis for Goldpac Group
- Earnings growth over the past year exceeded the industry.
- Debt is not viewed as a risk.
- Dividend is in the top 25% of dividend payers in the market.
- No major weaknesses identified for 3315.
- Current share price is below our estimate of fair value.
- Lack of analyst coverage makes it difficult to determine 3315's earnings prospects.
- Paying a dividend but company has no free cash flows.
What Can We Tell From Goldpac Group's ROCE Trend?
We are a bit worried about the trend of returns on capital at Goldpac Group. About five years ago, returns on capital were 9.0%, however they're now substantially lower than that as we saw above. On top of that, it's worth noting that the amount of capital employed within the business has remained relatively steady. This combination can be indicative of a mature business that still has areas to deploy capital, but the returns received aren't as high due potentially to new competition or smaller margins. So because these trends aren't typically conducive to creating a multi-bagger, we wouldn't hold our breath on Goldpac Group becoming one if things continue as they have.
In Conclusion...
All in all, the lower returns from the same amount of capital employed aren't exactly signs of a compounding machine. Despite the concerning underlying trends, the stock has actually gained 16% over the last five years, so it might be that the investors are expecting the trends to reverse. Regardless, we don't like the trends as they are and if they persist, we think you might find better investments elsewhere.
Since virtually every company faces some risks, it's worth knowing what they are, and we've spotted 2 warning signs for Goldpac Group (of which 1 can't be ignored!) that you should know about.
If you want to search for solid companies with great earnings, check out this free list of companies with good balance sheets and impressive returns on equity.
Mobile Infrastructure for Defense and Disaster
The next wave in robotics isn't humanoid. Its fully autonomous towers delivering 5G, ISR, and radar in under 30 minutes, anywhere.
Get the investor briefing before the next round of contracts
Sponsored On Behalf of CiTechNew: Manage All Your Stock Portfolios in One Place
We've created the ultimate portfolio companion for stock investors, and it's free.
• Connect an unlimited number of Portfolios and see your total in one currency
• Be alerted to new Warning Signs or Risks via email or mobile
• Track the Fair Value of your stocks
Have feedback on this article? Concerned about the content? Get in touch with us directly. Alternatively, email editorial-team (at) simplywallst.com.
This article by Simply Wall St is general in nature. We provide commentary based on historical data and analyst forecasts only using an unbiased methodology and our articles are not intended to be financial advice. It does not constitute a recommendation to buy or sell any stock, and does not take account of your objectives, or your financial situation. We aim to bring you long-term focused analysis driven by fundamental data. Note that our analysis may not factor in the latest price-sensitive company announcements or qualitative material. Simply Wall St has no position in any stocks mentioned.
About SEHK:3315
Goldpac Group
An investment holding company, provides embedded software, secure payment products, and smart financial self-service kiosks in the Mainland China and internationally.
Flawless balance sheet with slight risk.
Similar Companies
Market Insights

Weekly Picks

THE KINGDOM OF BROWN GOODS: WHY MGPI IS BEING CRUSHED BY INVENTORY & PRIMED FOR RESURRECTION


Why Vertical Aerospace (NYSE: EVTL) is Worth Possibly Over 13x its Current Price


The Quiet Giant That Became AI’s Power Grid
Recently Updated Narratives


Fiverr International will transform the freelance industry with AI-powered growth

Jackson Financial Stock: When Insurance Math Meets a Shifting Claims Landscape

Stride Stock: Online Education Finds Its Second Act
Popular Narratives


MicroVision will explode future revenue by 380.37% with a vision towards success


Crazy Undervalued 42 Baggers Silver Play (Active & Running Mine)


