
Advertisement
- Hong Kong
- /
- Electronic Equipment and Components
- /
- SEHK:1206
Getting In Cheap On Technovator International Limited (HKG:1206) Is Unlikely
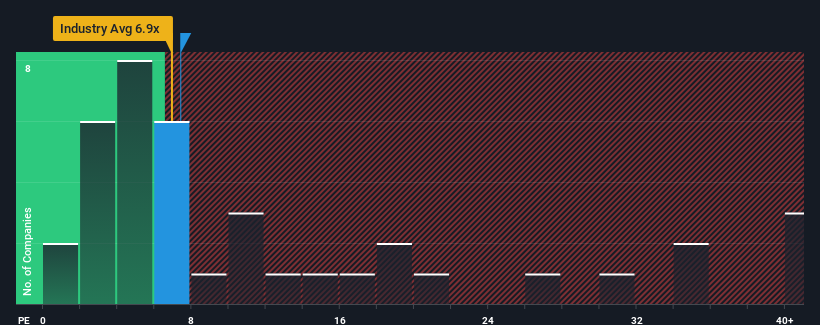
It's not a stretch to say that Technovator International Limited's (HKG:1206) price-to-earnings (or "P/E") ratio of 7.4x right now seems quite "middle-of-the-road" compared to the market in Hong Kong, where the median P/E ratio is around 9x. While this might not raise any eyebrows, if the P/E ratio is not justified investors could be missing out on a potential opportunity or ignoring looming disappointment.
For example, consider that Technovator International's financial performance has been poor lately as its earnings have been in decline. One possibility is that the P/E is moderate because investors think the company might still do enough to be in line with the broader market in the near future. If not, then existing shareholders may be a little nervous about the viability of the share price.
Check out our latest analysis for Technovator International
What Are Growth Metrics Telling Us About The P/E?
Technovator International's P/E ratio would be typical for a company that's only expected to deliver moderate growth, and importantly, perform in line with the market.
Retrospectively, the last year delivered a frustrating 28% decrease to the company's bottom line. This means it has also seen a slide in earnings over the longer-term as EPS is down 67% in total over the last three years. Accordingly, shareholders would have felt downbeat about the medium-term rates of earnings growth.
Comparing that to the market, which is predicted to deliver 23% growth in the next 12 months, the company's downward momentum based on recent medium-term earnings results is a sobering picture.
In light of this, it's somewhat alarming that Technovator International's P/E sits in line with the majority of other companies. It seems most investors are ignoring the recent poor growth rate and are hoping for a turnaround in the company's business prospects. Only the boldest would assume these prices are sustainable as a continuation of recent earnings trends is likely to weigh on the share price eventually.
The Key Takeaway
Typically, we'd caution against reading too much into price-to-earnings ratios when settling on investment decisions, though it can reveal plenty about what other market participants think about the company.
We've established that Technovator International currently trades on a higher than expected P/E since its recent earnings have been in decline over the medium-term. Right now we are uncomfortable with the P/E as this earnings performance is unlikely to support a more positive sentiment for long. Unless the recent medium-term conditions improve, it's challenging to accept these prices as being reasonable.
We don't want to rain on the parade too much, but we did also find 4 warning signs for Technovator International (1 is significant!) that you need to be mindful of.
It's important to make sure you look for a great company, not just the first idea you come across. So take a peek at this free list of interesting companies with strong recent earnings growth (and a low P/E).
Valuation is complex, but we're here to simplify it.
Discover if Technovator International might be undervalued or overvalued with our detailed analysis, featuring fair value estimates, potential risks, dividends, insider trades, and its financial condition.
Access Free AnalysisHave feedback on this article? Concerned about the content? Get in touch with us directly. Alternatively, email editorial-team (at) simplywallst.com.
This article by Simply Wall St is general in nature. We provide commentary based on historical data and analyst forecasts only using an unbiased methodology and our articles are not intended to be financial advice. It does not constitute a recommendation to buy or sell any stock, and does not take account of your objectives, or your financial situation. We aim to bring you long-term focused analysis driven by fundamental data. Note that our analysis may not factor in the latest price-sensitive company announcements or qualitative material. Simply Wall St has no position in any stocks mentioned.
About SEHK:1206
Technovator International
Provides urban energy saving services in the People’s Republic of China.
Adequate balance sheet and slightly overvalued.
Market Insights

Advertisement
Weekly Picks
FA

FAI on Arabian Internet and Communication Services ·
Solutions by stc: 34% Upside in Saudi's Digital Transformation Leader
Fair Value:ر.س342.2335.3% undervalued
9 followersusers have followed this narrative
1 commentusers have commented on this narrative
3 likesusers have liked this narrative
RO


RobertoAllende on NVIDIA ·
The AI Infrastructure Giant Grows Into Its Valuation
Fair Value:US$345.0747.9% undervalued
27 followersusers have followed this narrative
28 commentsusers have commented on this narrative
21 likesusers have liked this narrative
Recently Updated Narratives
TA


Talos on PayPal Holdings ·
The "Sleeping Giant" Wakes Up – Efficiency & Monetization
Fair Value:US$174.9264.2% undervalued
1 followerusers have followed this narrative
0 commentsusers have commented on this narrative
0 likesusers have liked this narrative
TA

Talos on Pagaya Technologies ·
The "Rate Cut" Supercycle Winner – Profitable & Accelerating
Fair Value:US$170.685.9% undervalued
1 followerusers have followed this narrative
0 commentsusers have commented on this narrative
0 likesusers have liked this narrative
TA

Talos on Archer Aviation ·
The Industrialist of the Skies – Scaling with "Automotive DNA
Fair Value:US$16.3254.3% undervalued
1 followerusers have followed this narrative
0 commentsusers have commented on this narrative
0 likesusers have liked this narrative
Popular Narratives
TH


TheWallstreetKing on MicroVision ·
MicroVision will explode future revenue by 380.37% with a vision towards success
Fair Value:US$6098.6% undervalued
110 followersusers have followed this narrative
11 commentsusers have commented on this narrative
22 likesusers have liked this narrative
AN

AnalystConsensusTarget on NVIDIA ·
NVDA: Expanding AI Demand Will Drive Major Data Center Investments Through 2026
Fair Value:US$250.3928.1% undervalued
944 followersusers have followed this narrative
6 commentsusers have commented on this narrative
24 likesusers have liked this narrative
OS


oscargarcia on Alphabet ·
The company that turned a verb into a global necessity and basically runs the modern internet, digital ads, smartphones, maps, and AI.
Fair Value:US$3407.4% undervalued
146 followersusers have followed this narrative
6 commentsusers have commented on this narrative
18 likesusers have liked this narrative