
Advertisement
Maxnerva Technology Services Limited (HKG:1037) Stock Catapults 32% Though Its Price And Business Still Lag The Industry
Maxnerva Technology Services Limited (HKG:1037) shareholders would be excited to see that the share price has had a great month, posting a 32% gain and recovering from prior weakness. The last 30 days bring the annual gain to a very sharp 52%.
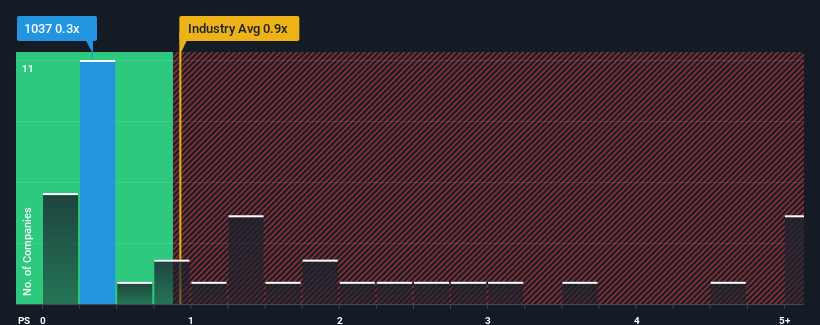
Even after such a large jump in price, it would still be understandable if you think Maxnerva Technology Services is a stock with good investment prospects with a price-to-sales ratios (or "P/S") of 0.3x, considering almost half the companies in Hong Kong's IT industry have P/S ratios above 0.9x. Although, it's not wise to just take the P/S at face value as there may be an explanation why it's limited.
Check out our latest analysis for Maxnerva Technology Services
How Has Maxnerva Technology Services Performed Recently?
For instance, Maxnerva Technology Services' receding revenue in recent times would have to be some food for thought. One possibility is that the P/S is low because investors think the company won't do enough to avoid underperforming the broader industry in the near future. However, if this doesn't eventuate then existing shareholders may be feeling optimistic about the future direction of the share price.
Want the full picture on earnings, revenue and cash flow for the company? Then our free report on Maxnerva Technology Services will help you shine a light on its historical performance.Is There Any Revenue Growth Forecasted For Maxnerva Technology Services?
There's an inherent assumption that a company should underperform the industry for P/S ratios like Maxnerva Technology Services' to be considered reasonable.
In reviewing the last year of financials, we were disheartened to see the company's revenues fell to the tune of 30%. Regardless, revenue has managed to lift by a handy 11% in aggregate from three years ago, thanks to the earlier period of growth. Although it's been a bumpy ride, it's still fair to say the revenue growth recently has been mostly respectable for the company.
Comparing the recent medium-term revenue trends against the industry's one-year growth forecast of 15% shows it's noticeably less attractive.
With this information, we can see why Maxnerva Technology Services is trading at a P/S lower than the industry. Apparently many shareholders weren't comfortable holding on to something they believe will continue to trail the wider industry.
What Does Maxnerva Technology Services' P/S Mean For Investors?
The latest share price surge wasn't enough to lift Maxnerva Technology Services' P/S close to the industry median. Typically, we'd caution against reading too much into price-to-sales ratios when settling on investment decisions, though it can reveal plenty about what other market participants think about the company.
In line with expectations, Maxnerva Technology Services maintains its low P/S on the weakness of its recent three-year growth being lower than the wider industry forecast. Right now shareholders are accepting the low P/S as they concede future revenue probably won't provide any pleasant surprises. Unless the recent medium-term conditions improve, they will continue to form a barrier for the share price around these levels.
There are also other vital risk factors to consider and we've discovered 2 warning signs for Maxnerva Technology Services (1 shouldn't be ignored!) that you should be aware of before investing here.
It's important to make sure you look for a great company, not just the first idea you come across. So if growing profitability aligns with your idea of a great company, take a peek at this free list of interesting companies with strong recent earnings growth (and a low P/E).
New: Manage All Your Stock Portfolios in One Place
We've created the ultimate portfolio companion for stock investors, and it's free.
• Connect an unlimited number of Portfolios and see your total in one currency
• Be alerted to new Warning Signs or Risks via email or mobile
• Track the Fair Value of your stocks
Have feedback on this article? Concerned about the content? Get in touch with us directly. Alternatively, email editorial-team (at) simplywallst.com.
This article by Simply Wall St is general in nature. We provide commentary based on historical data and analyst forecasts only using an unbiased methodology and our articles are not intended to be financial advice. It does not constitute a recommendation to buy or sell any stock, and does not take account of your objectives, or your financial situation. We aim to bring you long-term focused analysis driven by fundamental data. Note that our analysis may not factor in the latest price-sensitive company announcements or qualitative material. Simply Wall St has no position in any stocks mentioned.
About SEHK:1037
Maxnerva Technology Services
An investment holding company, operates in the digital industry and digital life businesses in the People’s Republic of China, Europe, the United States, Taiwan, Singapore, and internationally.
Flawless balance sheet with slight risk.
Market Insights

Advertisement
Community Narratives
A formidable player in AI and enterprise computing.
Fair Value US$210.00|3.9% overvalued
CO
Community Contributor
IREN's Bold Moves in Sustainable Bitcoin Mining & AI Data Centers
Fair Value US$89.00|21.8% undervalued
BL
Community Contributor
Cooling the Champions: The Aussie Tech Behind F1's Victories
Fair Value AU$12.40|40.6% undervalued
TR
Community Contributor