
Advertisement
- Hong Kong
- /
- Specialty Stores
- /
- SEHK:84
Stelux Holdings International Limited's (HKG:84) Share Price Could Signal Some Risk

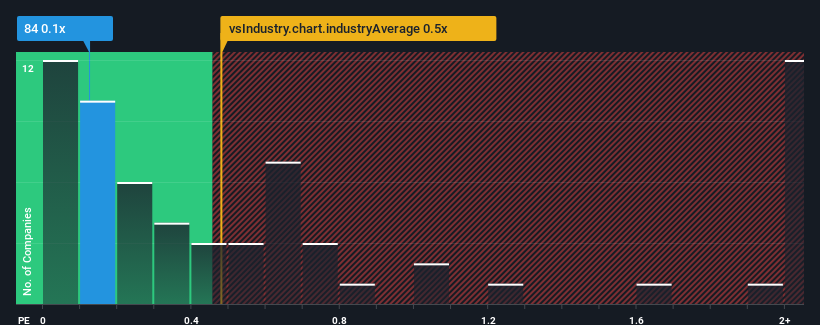
With a median price-to-sales (or "P/S") ratio of close to 0.5x in the Specialty Retail industry in Hong Kong, you could be forgiven for feeling indifferent about Stelux Holdings International Limited's (HKG:84) P/S ratio of 0.1x. However, investors might be overlooking a clear opportunity or potential setback if there is no rational basis for the P/S.
We've discovered 2 warning signs about Stelux Holdings International. View them for free.Check out our latest analysis for Stelux Holdings International
How Stelux Holdings International Has Been Performing
As an illustration, revenue has deteriorated at Stelux Holdings International over the last year, which is not ideal at all. One possibility is that the P/S is moderate because investors think the company might still do enough to be in line with the broader industry in the near future. If you like the company, you'd at least be hoping this is the case so that you could potentially pick up some stock while it's not quite in favour.
We don't have analyst forecasts, but you can see how recent trends are setting up the company for the future by checking out our free report on Stelux Holdings International's earnings, revenue and cash flow.How Is Stelux Holdings International's Revenue Growth Trending?
Stelux Holdings International's P/S ratio would be typical for a company that's only expected to deliver moderate growth, and importantly, perform in line with the industry.
In reviewing the last year of financials, we were disheartened to see the company's revenues fell to the tune of 8.3%. This has erased any of its gains during the last three years, with practically no change in revenue being achieved in total. Accordingly, shareholders probably wouldn't have been overly satisfied with the unstable medium-term growth rates.
Comparing that to the industry, which is predicted to deliver 41% growth in the next 12 months, the company's momentum is weaker, based on recent medium-term annualised revenue results.
In light of this, it's curious that Stelux Holdings International's P/S sits in line with the majority of other companies. Apparently many investors in the company are less bearish than recent times would indicate and aren't willing to let go of their stock right now. They may be setting themselves up for future disappointment if the P/S falls to levels more in line with recent growth rates.
What We Can Learn From Stelux Holdings International's P/S?
Generally, our preference is to limit the use of the price-to-sales ratio to establishing what the market thinks about the overall health of a company.
Our examination of Stelux Holdings International revealed its poor three-year revenue trends aren't resulting in a lower P/S as per our expectations, given they look worse than current industry outlook. Right now we are uncomfortable with the P/S as this revenue performance isn't likely to support a more positive sentiment for long. If recent medium-term revenue trends continue, the probability of a share price decline will become quite substantial, placing shareholders at risk.
There are also other vital risk factors to consider and we've discovered 2 warning signs for Stelux Holdings International (1 can't be ignored!) that you should be aware of before investing here.
If these risks are making you reconsider your opinion on Stelux Holdings International, explore our interactive list of high quality stocks to get an idea of what else is out there.
New: Manage All Your Stock Portfolios in One Place
We've created the ultimate portfolio companion for stock investors, and it's free.
• Connect an unlimited number of Portfolios and see your total in one currency
• Be alerted to new Warning Signs or Risks via email or mobile
• Track the Fair Value of your stocks
Have feedback on this article? Concerned about the content? Get in touch with us directly. Alternatively, email editorial-team (at) simplywallst.com.
This article by Simply Wall St is general in nature. We provide commentary based on historical data and analyst forecasts only using an unbiased methodology and our articles are not intended to be financial advice. It does not constitute a recommendation to buy or sell any stock, and does not take account of your objectives, or your financial situation. We aim to bring you long-term focused analysis driven by fundamental data. Note that our analysis may not factor in the latest price-sensitive company announcements or qualitative material. Simply Wall St has no position in any stocks mentioned.
About SEHK:84
Stelux Holdings International
An investment holding company, engages in the trading, wholesale and retail of watches in Hong Kong, Macau, Mainland China, the rest of Asia, and Europe.
Flawless balance sheet and slightly overvalued.
Market Insights

Advertisement
Community Narratives
Pole position to benefit from GENIUS Act
Fair Value US$233.04|59.7% undervalued
CH
Community Contributor
IREN will transform from bitcoin miner to leader in AI infrastructure
Fair Value US$21.48|13.5% undervalued
KA
Community Contributor
Behind the Assay: XRF Scientific’s Role in Modern Mining Economics
Fair Value AU$2.10|1.4% undervalued
RO
Community Contributor