- Hong Kong
- /
- Retail Distributors
- /
- SEHK:8179
Palinda Group Holdings Limited (HKG:8179) Stocks Shoot Up 40% But Its P/S Still Looks Reasonable


Despite an already strong run, Palinda Group Holdings Limited (HKG:8179) shares have been powering on, with a gain of 40% in the last thirty days. Not all shareholders will be feeling jubilant, since the share price is still down a very disappointing 36% in the last twelve months.
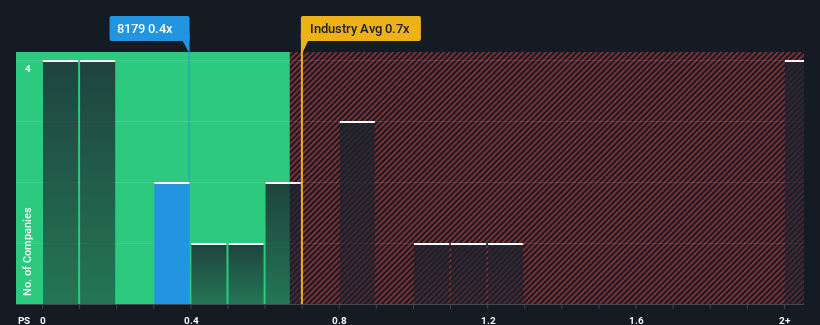
In spite of the firm bounce in price, it's still not a stretch to say that Palinda Group Holdings' price-to-sales (or "P/S") ratio of 0.4x right now seems quite "middle-of-the-road" compared to the Retail Distributors industry in Hong Kong, where the median P/S ratio is around 0.7x. Although, it's not wise to simply ignore the P/S without explanation as investors may be disregarding a distinct opportunity or a costly mistake.
View our latest analysis for Palinda Group Holdings
What Does Palinda Group Holdings' P/S Mean For Shareholders?
Palinda Group Holdings has been doing a good job lately as it's been growing revenue at a solid pace. It might be that many expect the respectable revenue performance to wane, which has kept the P/S from rising. Those who are bullish on Palinda Group Holdings will be hoping that this isn't the case, so that they can pick up the stock at a lower valuation.
We don't have analyst forecasts, but you can see how recent trends are setting up the company for the future by checking out our free report on Palinda Group Holdings' earnings, revenue and cash flow.Do Revenue Forecasts Match The P/S Ratio?
Palinda Group Holdings' P/S ratio would be typical for a company that's only expected to deliver moderate growth, and importantly, perform in line with the industry.
Retrospectively, the last year delivered an exceptional 26% gain to the company's top line. The latest three year period has also seen an excellent 116% overall rise in revenue, aided by its short-term performance. Therefore, it's fair to say the revenue growth recently has been superb for the company.
Weighing that recent medium-term revenue trajectory against the broader industry's one-year forecast for expansion of 32% shows it's about the same on an annualised basis.
With this information, we can see why Palinda Group Holdings is trading at a fairly similar P/S to the industry. It seems most investors are expecting to see average growth rates continue into the future and are only willing to pay a moderate amount for the stock.
The Key Takeaway
Its shares have lifted substantially and now Palinda Group Holdings' P/S is back within range of the industry median. We'd say the price-to-sales ratio's power isn't primarily as a valuation instrument but rather to gauge current investor sentiment and future expectations.
It appears to us that Palinda Group Holdings maintains its moderate P/S off the back of its recent three-year growth being in line with the wider industry forecast. Right now shareholders are comfortable with the P/S as they are quite confident future revenue won't throw up any surprises. Unless the recent medium-term conditions change, they will continue to support the share price at these levels.
There are also other vital risk factors to consider and we've discovered 4 warning signs for Palinda Group Holdings (1 is a bit concerning!) that you should be aware of before investing here.
If you're unsure about the strength of Palinda Group Holdings' business, why not explore our interactive list of stocks with solid business fundamentals for some other companies you may have missed.
New: Manage All Your Stock Portfolios in One Place
We've created the ultimate portfolio companion for stock investors, and it's free.
• Connect an unlimited number of Portfolios and see your total in one currency
• Be alerted to new Warning Signs or Risks via email or mobile
• Track the Fair Value of your stocks
Have feedback on this article? Concerned about the content? Get in touch with us directly. Alternatively, email editorial-team (at) simplywallst.com.
This article by Simply Wall St is general in nature. We provide commentary based on historical data and analyst forecasts only using an unbiased methodology and our articles are not intended to be financial advice. It does not constitute a recommendation to buy or sell any stock, and does not take account of your objectives, or your financial situation. We aim to bring you long-term focused analysis driven by fundamental data. Note that our analysis may not factor in the latest price-sensitive company announcements or qualitative material. Simply Wall St has no position in any stocks mentioned.
Have feedback on this article? Concerned about the content? Get in touch with us directly. Alternatively, email editorial-team@simplywallst.com
About SEHK:8179
Palinda Group Holdings
An investment holding company, engages in the sales and distribution of wine products and ancillary wines-related products in Hong Kong and Australia.
Flawless balance sheet low.
