- Hong Kong
- /
- Retail Distributors
- /
- SEHK:8179
Further Upside For Palinda Group Holdings Limited (HKG:8179) Shares Could Introduce Price Risks After 27% Bounce


Palinda Group Holdings Limited (HKG:8179) shares have continued their recent momentum with a 27% gain in the last month alone. Unfortunately, the gains of the last month did little to right the losses of the last year with the stock still down 42% over that time.
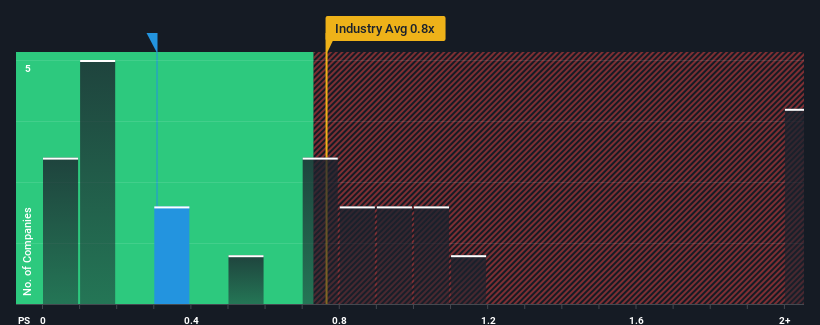
In spite of the firm bounce in price, it's still not a stretch to say that Palinda Group Holdings' price-to-sales (or "P/S") ratio of 0.3x right now seems quite "middle-of-the-road" compared to the Retail Distributors industry in Hong Kong, where the median P/S ratio is around 0.8x. While this might not raise any eyebrows, if the P/S ratio is not justified investors could be missing out on a potential opportunity or ignoring looming disappointment.
Check out our latest analysis for Palinda Group Holdings
What Does Palinda Group Holdings' P/S Mean For Shareholders?
Revenue has risen firmly for Palinda Group Holdings recently, which is pleasing to see. It might be that many expect the respectable revenue performance to wane, which has kept the P/S from rising. Those who are bullish on Palinda Group Holdings will be hoping that this isn't the case, so that they can pick up the stock at a lower valuation.
Although there are no analyst estimates available for Palinda Group Holdings, take a look at this free data-rich visualisation to see how the company stacks up on earnings, revenue and cash flow.What Are Revenue Growth Metrics Telling Us About The P/S?
There's an inherent assumption that a company should be matching the industry for P/S ratios like Palinda Group Holdings' to be considered reasonable.
Retrospectively, the last year delivered an exceptional 26% gain to the company's top line. The strong recent performance means it was also able to grow revenue by 116% in total over the last three years. Therefore, it's fair to say the revenue growth recently has been superb for the company.
Comparing that recent medium-term revenue trajectory with the industry's one-year growth forecast of 23% shows it's noticeably more attractive.
In light of this, it's curious that Palinda Group Holdings' P/S sits in line with the majority of other companies. Apparently some shareholders believe the recent performance is at its limits and have been accepting lower selling prices.
The Final Word
Palinda Group Holdings appears to be back in favour with a solid price jump bringing its P/S back in line with other companies in the industry We'd say the price-to-sales ratio's power isn't primarily as a valuation instrument but rather to gauge current investor sentiment and future expectations.
We didn't quite envision Palinda Group Holdings' P/S sitting in line with the wider industry, considering the revenue growth over the last three-year is higher than the current industry outlook. When we see strong revenue with faster-than-industry growth, we can only assume potential risks are what might be placing pressure on the P/S ratio. At least the risk of a price drop looks to be subdued if recent medium-term revenue trends continue, but investors seem to think future revenue could see some volatility.
We don't want to rain on the parade too much, but we did also find 4 warning signs for Palinda Group Holdings (2 don't sit too well with us!) that you need to be mindful of.
If these risks are making you reconsider your opinion on Palinda Group Holdings, explore our interactive list of high quality stocks to get an idea of what else is out there.
New: Manage All Your Stock Portfolios in One Place
We've created the ultimate portfolio companion for stock investors, and it's free.
• Connect an unlimited number of Portfolios and see your total in one currency
• Be alerted to new Warning Signs or Risks via email or mobile
• Track the Fair Value of your stocks
Have feedback on this article? Concerned about the content? Get in touch with us directly. Alternatively, email editorial-team (at) simplywallst.com.
This article by Simply Wall St is general in nature. We provide commentary based on historical data and analyst forecasts only using an unbiased methodology and our articles are not intended to be financial advice. It does not constitute a recommendation to buy or sell any stock, and does not take account of your objectives, or your financial situation. We aim to bring you long-term focused analysis driven by fundamental data. Note that our analysis may not factor in the latest price-sensitive company announcements or qualitative material. Simply Wall St has no position in any stocks mentioned.
About SEHK:8179
Palinda Group Holdings
An investment holding company, engages in the sales and distribution of wine products and ancillary wines-related products in Hong Kong and Australia.
Flawless balance sheet low.
