
Advertisement
- Hong Kong
- /
- Specialty Stores
- /
- SEHK:1929
A Look At The Fair Value Of Chow Tai Fook Jewellery Group Limited (HKG:1929)

Key Insights
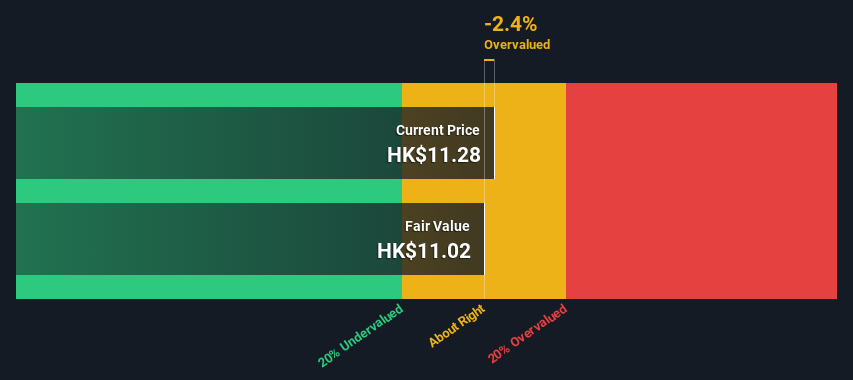
- Using the 2 Stage Free Cash Flow to Equity, Chow Tai Fook Jewellery Group fair value estimate is HK$11.02
- With HK$11.28 share price, Chow Tai Fook Jewellery Group appears to be trading close to its estimated fair value
- The HK$14.78 analyst price target for 1929 is 34% more than our estimate of fair value
How far off is Chow Tai Fook Jewellery Group Limited (HKG:1929) from its intrinsic value? Using the most recent financial data, we'll take a look at whether the stock is fairly priced by taking the forecast future cash flows of the company and discounting them back to today's value. Our analysis will employ the Discounted Cash Flow (DCF) model. Models like these may appear beyond the comprehension of a lay person, but they're fairly easy to follow.
Companies can be valued in a lot of ways, so we would point out that a DCF is not perfect for every situation. For those who are keen learners of equity analysis, the Simply Wall St analysis model here may be something of interest to you.
See our latest analysis for Chow Tai Fook Jewellery Group
The Calculation
We're using the 2-stage growth model, which simply means we take in account two stages of company's growth. In the initial period the company may have a higher growth rate and the second stage is usually assumed to have a stable growth rate. To start off with, we need to estimate the next ten years of cash flows. Where possible we use analyst estimates, but when these aren't available we extrapolate the previous free cash flow (FCF) from the last estimate or reported value. We assume companies with shrinking free cash flow will slow their rate of shrinkage, and that companies with growing free cash flow will see their growth rate slow, over this period. We do this to reflect that growth tends to slow more in the early years than it does in later years.
Generally we assume that a dollar today is more valuable than a dollar in the future, so we need to discount the sum of these future cash flows to arrive at a present value estimate:
10-year free cash flow (FCF) forecast
| 2024 | 2025 | 2026 | 2027 | 2028 | 2029 | 2030 | 2031 | 2032 | 2033 | |
| Levered FCF (HK$, Millions) | HK$10.6b | HK$8.81b | HK$8.30b | HK$8.04b | HK$7.90b | HK$7.86b | HK$7.87b | HK$7.93b | HK$8.02b | HK$8.13b |
| Growth Rate Estimate Source | Analyst x4 | Analyst x4 | Analyst x5 | Est @ -3.22% | Est @ -1.66% | Est @ -0.57% | Est @ 0.19% | Est @ 0.72% | Est @ 1.10% | Est @ 1.36% |
| Present Value (HK$, Millions) Discounted @ 8.6% | HK$9.8k | HK$7.5k | HK$6.5k | HK$5.8k | HK$5.2k | HK$4.8k | HK$4.4k | HK$4.1k | HK$3.8k | HK$3.6k |
("Est" = FCF growth rate estimated by Simply Wall St)
Present Value of 10-year Cash Flow (PVCF) = HK$55b
We now need to calculate the Terminal Value, which accounts for all the future cash flows after this ten year period. The Gordon Growth formula is used to calculate Terminal Value at a future annual growth rate equal to the 5-year average of the 10-year government bond yield of 2.0%. We discount the terminal cash flows to today's value at a cost of equity of 8.6%.
Terminal Value (TV)= FCF2033 × (1 + g) ÷ (r – g) = HK$8.1b× (1 + 2.0%) ÷ (8.6%– 2.0%) = HK$125b
Present Value of Terminal Value (PVTV)= TV / (1 + r)10= HK$125b÷ ( 1 + 8.6%)10= HK$55b
The total value is the sum of cash flows for the next ten years plus the discounted terminal value, which results in the Total Equity Value, which in this case is HK$110b. The last step is to then divide the equity value by the number of shares outstanding. Relative to the current share price of HK$11.3, the company appears around fair value at the time of writing. The assumptions in any calculation have a big impact on the valuation, so it is better to view this as a rough estimate, not precise down to the last cent.
The Assumptions
We would point out that the most important inputs to a discounted cash flow are the discount rate and of course the actual cash flows. Part of investing is coming up with your own evaluation of a company's future performance, so try the calculation yourself and check your own assumptions. The DCF also does not consider the possible cyclicality of an industry, or a company's future capital requirements, so it does not give a full picture of a company's potential performance. Given that we are looking at Chow Tai Fook Jewellery Group as potential shareholders, the cost of equity is used as the discount rate, rather than the cost of capital (or weighted average cost of capital, WACC) which accounts for debt. In this calculation we've used 8.6%, which is based on a levered beta of 1.123. Beta is a measure of a stock's volatility, compared to the market as a whole. We get our beta from the industry average beta of globally comparable companies, with an imposed limit between 0.8 and 2.0, which is a reasonable range for a stable business.
SWOT Analysis for Chow Tai Fook Jewellery Group
Strength
- Earnings growth over the past year exceeded the industry.
- Debt is well covered by earnings and cashflows.
- Dividends are covered by earnings and cash flows.
Weakness
- Earnings growth over the past year is below its 5-year average.
- Dividend is low compared to the top 25% of dividend payers in the Specialty Retail market.
- Expensive based on P/E ratio and estimated fair value.
Opportunity
- Annual earnings are forecast to grow faster than the Hong Kong market.
Threat
- Revenue is forecast to grow slower than 20% per year.
Next Steps:
Whilst important, the DCF calculation ideally won't be the sole piece of analysis you scrutinize for a company. It's not possible to obtain a foolproof valuation with a DCF model. Rather it should be seen as a guide to "what assumptions need to be true for this stock to be under/overvalued?" For example, changes in the company's cost of equity or the risk free rate can significantly impact the valuation. For Chow Tai Fook Jewellery Group, there are three relevant items you should further examine:
- Risks: We feel that you should assess the 2 warning signs for Chow Tai Fook Jewellery Group we've flagged before making an investment in the company.
- Future Earnings: How does 1929's growth rate compare to its peers and the wider market? Dig deeper into the analyst consensus number for the upcoming years by interacting with our free analyst growth expectation chart.
- Other High Quality Alternatives: Do you like a good all-rounder? Explore our interactive list of high quality stocks to get an idea of what else is out there you may be missing!
PS. The Simply Wall St app conducts a discounted cash flow valuation for every stock on the SEHK every day. If you want to find the calculation for other stocks just search here.
New: AI Stock Screener & Alerts
Our new AI Stock Screener scans the market every day to uncover opportunities.
• Dividend Powerhouses (3%+ Yield)
• Undervalued Small Caps with Insider Buying
• High growth Tech and AI Companies
Or build your own from over 50 metrics.
Have feedback on this article? Concerned about the content? Get in touch with us directly. Alternatively, email editorial-team (at) simplywallst.com.
This article by Simply Wall St is general in nature. We provide commentary based on historical data and analyst forecasts only using an unbiased methodology and our articles are not intended to be financial advice. It does not constitute a recommendation to buy or sell any stock, and does not take account of your objectives, or your financial situation. We aim to bring you long-term focused analysis driven by fundamental data. Note that our analysis may not factor in the latest price-sensitive company announcements or qualitative material. Simply Wall St has no position in any stocks mentioned.
About SEHK:1929
Chow Tai Fook Jewellery Group
An investment holding company, manufactures and sells jewelry products in Mainland China, Hong Kong, Macau, and internationally.
Excellent balance sheet with proven track record and pays a dividend.
Similar Companies
Market Insights


Advertisement
Community Narratives
Suncorp’s Next Chapter: Insurance-Only and Ready to Grow
Fair Value AU$22.83|4.9% undervalued
RO
Community Contributor
Thyssenkrupp Nucera Will Achieve Double-Digit Profits by 2030 Boosted by Hydrogen Growth
Fair Value €14.40|32.5% undervalued
CH
Community Contributor
Tesla’s Nvidia Moment – The AI & Robotics Inflection Point
Fair Value US$384.84|21.9% undervalued
BL
Community Contributor