- Hong Kong
- /
- Real Estate
- /
- SEHK:535
The three-year loss for Gemdale Properties and Investment (HKG:535) shareholders likely driven by its shrinking earnings


Gemdale Properties and Investment Corporation Limited (HKG:535) shareholders should be happy to see the share price up 12% in the last month. But the last three years have seen a terrible decline. To wit, the share price sky-dived 76% in that time. So it's about time shareholders saw some gains. But the more important question is whether the underlying business can justify a higher price still.
The recent uptick of 9.4% could be a positive sign of things to come, so let's take a look at historical fundamentals.
Check out our latest analysis for Gemdale Properties and Investment
There is no denying that markets are sometimes efficient, but prices do not always reflect underlying business performance. One flawed but reasonable way to assess how sentiment around a company has changed is to compare the earnings per share (EPS) with the share price.
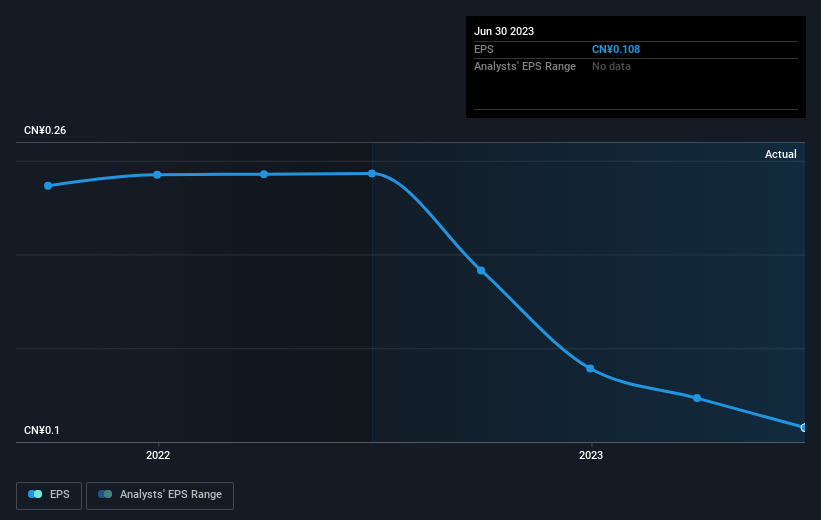
Gemdale Properties and Investment saw its EPS decline at a compound rate of 26% per year, over the last three years. This reduction in EPS is slower than the 38% annual reduction in the share price. So it's likely that the EPS decline has disappointed the market, leaving investors hesitant to buy. The less favorable sentiment is reflected in its current P/E ratio of 2.48.
The image below shows how EPS has tracked over time (if you click on the image you can see greater detail).
It's probably worth noting we've seen significant insider buying in the last quarter, which we consider a positive. That said, we think earnings and revenue growth trends are even more important factors to consider. Before buying or selling a stock, we always recommend a close examination of historic growth trends, available here..
What About Dividends?
When looking at investment returns, it is important to consider the difference between total shareholder return (TSR) and share price return. The TSR is a return calculation that accounts for the value of cash dividends (assuming that any dividend received was reinvested) and the calculated value of any discounted capital raisings and spin-offs. Arguably, the TSR gives a more comprehensive picture of the return generated by a stock. We note that for Gemdale Properties and Investment the TSR over the last 3 years was -71%, which is better than the share price return mentioned above. The dividends paid by the company have thusly boosted the total shareholder return.
A Different Perspective
While the broader market lost about 10% in the twelve months, Gemdale Properties and Investment shareholders did even worse, losing 52% (even including dividends). However, it could simply be that the share price has been impacted by broader market jitters. It might be worth keeping an eye on the fundamentals, in case there's a good opportunity. Unfortunately, last year's performance may indicate unresolved challenges, given that it was worse than the annualised loss of 9% over the last half decade. Generally speaking long term share price weakness can be a bad sign, though contrarian investors might want to research the stock in hope of a turnaround. While it is well worth considering the different impacts that market conditions can have on the share price, there are other factors that are even more important. Even so, be aware that Gemdale Properties and Investment is showing 3 warning signs in our investment analysis , and 1 of those makes us a bit uncomfortable...
If you like to buy stocks alongside management, then you might just love this free list of companies. (Hint: insiders have been buying them).
Please note, the market returns quoted in this article reflect the market weighted average returns of stocks that currently trade on Hong Kong exchanges.
New: Manage All Your Stock Portfolios in One Place
We've created the ultimate portfolio companion for stock investors, and it's free.
• Connect an unlimited number of Portfolios and see your total in one currency
• Be alerted to new Warning Signs or Risks via email or mobile
• Track the Fair Value of your stocks
Have feedback on this article? Concerned about the content? Get in touch with us directly. Alternatively, email editorial-team (at) simplywallst.com.
This article by Simply Wall St is general in nature. We provide commentary based on historical data and analyst forecasts only using an unbiased methodology and our articles are not intended to be financial advice. It does not constitute a recommendation to buy or sell any stock, and does not take account of your objectives, or your financial situation. We aim to bring you long-term focused analysis driven by fundamental data. Note that our analysis may not factor in the latest price-sensitive company announcements or qualitative material. Simply Wall St has no position in any stocks mentioned.
About SEHK:535
Gemdale Properties and Investment
An investment holding company, engages in the property investment, development, and management activities in Mainland China.
Good value with mediocre balance sheet.
Similar Companies
Market Insights

Community Narratives

