- Hong Kong
- /
- Real Estate
- /
- SEHK:1379
Calculating The Intrinsic Value Of Wenling Zhejiang Measuring and Cutting Tools Trading Centre Company Limited (HKG:1379)

Key Insights
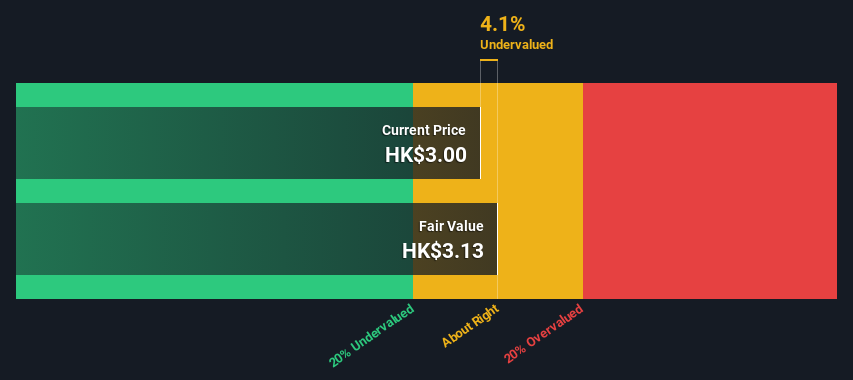
- Using the 2 Stage Free Cash Flow to Equity, Wenling Zhejiang Measuring and Cutting Tools Trading Centre fair value estimate is HK$3.13
- Wenling Zhejiang Measuring and Cutting Tools Trading Centre's HK$3.00 share price indicates it is trading at similar levels as its fair value estimate
- Wenling Zhejiang Measuring and Cutting Tools Trading Centre's peers are currently trading at a premium of 11% on average
How far off is Wenling Zhejiang Measuring and Cutting Tools Trading Centre Company Limited (HKG:1379) from its intrinsic value? Using the most recent financial data, we'll take a look at whether the stock is fairly priced by taking the expected future cash flows and discounting them to their present value. This will be done using the Discounted Cash Flow (DCF) model. There's really not all that much to it, even though it might appear quite complex.
Remember though, that there are many ways to estimate a company's value, and a DCF is just one method. If you still have some burning questions about this type of valuation, take a look at the Simply Wall St analysis model.
See our latest analysis for Wenling Zhejiang Measuring and Cutting Tools Trading Centre
What's The Estimated Valuation?
We're using the 2-stage growth model, which simply means we take in account two stages of company's growth. In the initial period the company may have a higher growth rate and the second stage is usually assumed to have a stable growth rate. To begin with, we have to get estimates of the next ten years of cash flows. Seeing as no analyst estimates of free cash flow are available to us, we have extrapolate the previous free cash flow (FCF) from the company's last reported value. We assume companies with shrinking free cash flow will slow their rate of shrinkage, and that companies with growing free cash flow will see their growth rate slow, over this period. We do this to reflect that growth tends to slow more in the early years than it does in later years.
Generally we assume that a dollar today is more valuable than a dollar in the future, so we discount the value of these future cash flows to their estimated value in today's dollars:
10-year free cash flow (FCF) estimate
| 2024 | 2025 | 2026 | 2027 | 2028 | 2029 | 2030 | 2031 | 2032 | 2033 | |
| Levered FCF (CN¥, Millions) | CN¥15.7m | CN¥15.3m | CN¥15.2m | CN¥15.1m | CN¥15.2m | CN¥15.4m | CN¥15.6m | CN¥15.8m | CN¥16.0m | CN¥16.3m |
| Growth Rate Estimate Source | Est @ -4.10% | Est @ -2.28% | Est @ -1.00% | Est @ -0.11% | Est @ 0.51% | Est @ 0.95% | Est @ 1.26% | Est @ 1.47% | Est @ 1.62% | Est @ 1.73% |
| Present Value (CN¥, Millions) Discounted @ 7.9% | CN¥14.5 | CN¥13.1 | CN¥12.1 | CN¥11.2 | CN¥10.4 | CN¥9.7 | CN¥9.1 | CN¥8.6 | CN¥8.1 | CN¥7.6 |
("Est" = FCF growth rate estimated by Simply Wall St)
Present Value of 10-year Cash Flow (PVCF) = CN¥104m
We now need to calculate the Terminal Value, which accounts for all the future cash flows after this ten year period. The Gordon Growth formula is used to calculate Terminal Value at a future annual growth rate equal to the 5-year average of the 10-year government bond yield of 2.0%. We discount the terminal cash flows to today's value at a cost of equity of 7.9%.
Terminal Value (TV)= FCF2033 × (1 + g) ÷ (r – g) = CN¥16m× (1 + 2.0%) ÷ (7.9%– 2.0%) = CN¥279m
Present Value of Terminal Value (PVTV)= TV / (1 + r)10= CN¥279m÷ ( 1 + 7.9%)10= CN¥130m
The total value is the sum of cash flows for the next ten years plus the discounted terminal value, which results in the Total Equity Value, which in this case is CN¥234m. The last step is to then divide the equity value by the number of shares outstanding. Relative to the current share price of HK$3.0, the company appears about fair value at a 4.1% discount to where the stock price trades currently. Remember though, that this is just an approximate valuation, and like any complex formula - garbage in, garbage out.
The Assumptions
We would point out that the most important inputs to a discounted cash flow are the discount rate and of course the actual cash flows. Part of investing is coming up with your own evaluation of a company's future performance, so try the calculation yourself and check your own assumptions. The DCF also does not consider the possible cyclicality of an industry, or a company's future capital requirements, so it does not give a full picture of a company's potential performance. Given that we are looking at Wenling Zhejiang Measuring and Cutting Tools Trading Centre as potential shareholders, the cost of equity is used as the discount rate, rather than the cost of capital (or weighted average cost of capital, WACC) which accounts for debt. In this calculation we've used 7.9%, which is based on a levered beta of 0.985. Beta is a measure of a stock's volatility, compared to the market as a whole. We get our beta from the industry average beta of globally comparable companies, with an imposed limit between 0.8 and 2.0, which is a reasonable range for a stable business.
SWOT Analysis for Wenling Zhejiang Measuring and Cutting Tools Trading Centre
- Earnings growth over the past year exceeded the industry.
- Currently debt free.
- Dividend is low compared to the top 25% of dividend payers in the Real Estate market.
- Current share price is below our estimate of fair value.
- Lack of analyst coverage makes it difficult to determine 1379's earnings prospects.
- Dividends are not covered by cash flow.
Looking Ahead:
Whilst important, the DCF calculation shouldn't be the only metric you look at when researching a company. DCF models are not the be-all and end-all of investment valuation. Rather it should be seen as a guide to "what assumptions need to be true for this stock to be under/overvalued?" For instance, if the terminal value growth rate is adjusted slightly, it can dramatically alter the overall result. For Wenling Zhejiang Measuring and Cutting Tools Trading Centre, we've compiled three pertinent items you should assess:
- Risks: For instance, we've identified 3 warning signs for Wenling Zhejiang Measuring and Cutting Tools Trading Centre that you should be aware of.
- Other Solid Businesses: Low debt, high returns on equity and good past performance are fundamental to a strong business. Why not explore our interactive list of stocks with solid business fundamentals to see if there are other companies you may not have considered!
- Other Top Analyst Picks: Interested to see what the analysts are thinking? Take a look at our interactive list of analysts' top stock picks to find out what they feel might have an attractive future outlook!
PS. Simply Wall St updates its DCF calculation for every Hong Kong stock every day, so if you want to find the intrinsic value of any other stock just search here.
The New Payments ETF Is Live on NASDAQ:
Money is moving to real-time rails, and a newly listed ETF now gives investors direct exposure. Fast settlement. Institutional custody. Simple access.
Explore how this launch could reshape portfolios
Sponsored ContentValuation is complex, but we're here to simplify it.
Discover if Wenling Zhejiang Measuring and Cutting Tools Trading Centre might be undervalued or overvalued with our detailed analysis, featuring fair value estimates, potential risks, dividends, insider trades, and its financial condition.
Access Free AnalysisHave feedback on this article? Concerned about the content? Get in touch with us directly. Alternatively, email editorial-team (at) simplywallst.com.
This article by Simply Wall St is general in nature. We provide commentary based on historical data and analyst forecasts only using an unbiased methodology and our articles are not intended to be financial advice. It does not constitute a recommendation to buy or sell any stock, and does not take account of your objectives, or your financial situation. We aim to bring you long-term focused analysis driven by fundamental data. Note that our analysis may not factor in the latest price-sensitive company announcements or qualitative material. Simply Wall St has no position in any stocks mentioned.
About SEHK:1379
Wenling Zhejiang Measuring and Cutting Tools Trading Centre
Provides property leasing and property management services in Mainland China.
Adequate balance sheet with slight risk.
Market Insights

Weekly Picks

Early mover in a fast growing industry. Likely to experience share price volatility as they scale


A case for CA$31.80 (undiluted), aka 8,616% upside from CA$0.37 (an 86 bagger!).


Moderation and Stabilisation: HOLD: Fair Price based on a 4-year Cycle is $12.08
Recently Updated Narratives

Amazon: Why the World’s Biggest Platform Still Runs on Invisible Economics

Sunrun Stock: When the Energy Transition Collides With the Cost of Capital

Salesforce Stock: AI-Fueled Growth Is Real — But Can Margins Stay This Strong?
Popular Narratives


MicroVision will explode future revenue by 380.37% with a vision towards success


Crazy Undervalued 42 Baggers Silver Play (Active & Running Mine)


