Ascentage Pharma Group International's (HKG:6855) Shares Climb 26% But Its Business Is Yet to Catch Up
Despite an already strong run, Ascentage Pharma Group International (HKG:6855) shares have been powering on, with a gain of 26% in the last thirty days. The last 30 days bring the annual gain to a very sharp 49%.
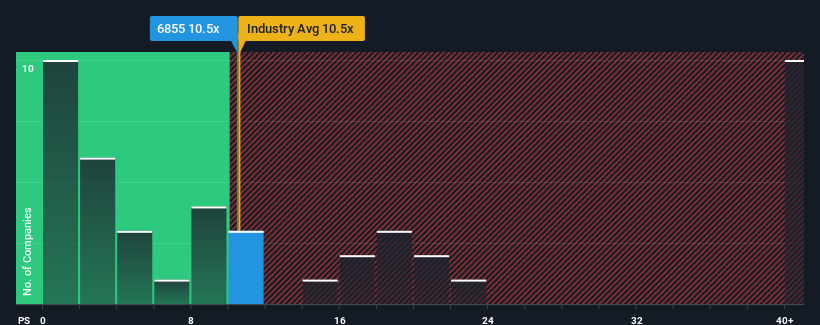
In spite of the firm bounce in price, there still wouldn't be many who think Ascentage Pharma Group International's price-to-sales (or "P/S") ratio of 10.5x is worth a mention when it essentially matches the median P/S in Hong Kong's Biotechs industry. However, investors might be overlooking a clear opportunity or potential setback if there is no rational basis for the P/S.
See our latest analysis for Ascentage Pharma Group International

How Ascentage Pharma Group International Has Been Performing
Recent times have been advantageous for Ascentage Pharma Group International as its revenues have been rising faster than most other companies. One possibility is that the P/S ratio is moderate because investors think this strong revenue performance might be about to tail off. If the company manages to stay the course, then investors should be rewarded with a share price that matches its revenue figures.
Keen to find out how analysts think Ascentage Pharma Group International's future stacks up against the industry? In that case, our free report is a great place to start.What Are Revenue Growth Metrics Telling Us About The P/S?
The only time you'd be comfortable seeing a P/S like Ascentage Pharma Group International's is when the company's growth is tracking the industry closely.
Retrospectively, the last year delivered an explosive gain to the company's top line. The amazing performance means it was also able to deliver huge revenue growth over the last three years. Accordingly, shareholders would have been over the moon with those medium-term rates of revenue growth.
Looking ahead now, revenue is anticipated to climb by 30% per annum during the coming three years according to the four analysts following the company. That's shaping up to be materially lower than the 57% each year growth forecast for the broader industry.
With this in mind, we find it intriguing that Ascentage Pharma Group International's P/S is closely matching its industry peers. It seems most investors are ignoring the fairly limited growth expectations and are willing to pay up for exposure to the stock. These shareholders may be setting themselves up for future disappointment if the P/S falls to levels more in line with the growth outlook.
The Bottom Line On Ascentage Pharma Group International's P/S
Ascentage Pharma Group International appears to be back in favour with a solid price jump bringing its P/S back in line with other companies in the industry Generally, our preference is to limit the use of the price-to-sales ratio to establishing what the market thinks about the overall health of a company.
When you consider that Ascentage Pharma Group International's revenue growth estimates are fairly muted compared to the broader industry, it's easy to see why we consider it unexpected to be trading at its current P/S ratio. At present, we aren't confident in the P/S as the predicted future revenues aren't likely to support a more positive sentiment for long. Circumstances like this present a risk to current and prospective investors who may see share prices fall if the low revenue growth impacts the sentiment.
There are also other vital risk factors to consider before investing and we've discovered 2 warning signs for Ascentage Pharma Group International that you should be aware of.
If companies with solid past earnings growth is up your alley, you may wish to see this free collection of other companies with strong earnings growth and low P/E ratios.
New: Manage All Your Stock Portfolios in One Place
We've created the ultimate portfolio companion for stock investors, and it's free.
• Connect an unlimited number of Portfolios and see your total in one currency
• Be alerted to new Warning Signs or Risks via email or mobile
• Track the Fair Value of your stocks
Have feedback on this article? Concerned about the content? Get in touch with us directly. Alternatively, email editorial-team (at) simplywallst.com.
This article by Simply Wall St is general in nature. We provide commentary based on historical data and analyst forecasts only using an unbiased methodology and our articles are not intended to be financial advice. It does not constitute a recommendation to buy or sell any stock, and does not take account of your objectives, or your financial situation. We aim to bring you long-term focused analysis driven by fundamental data. Note that our analysis may not factor in the latest price-sensitive company announcements or qualitative material. Simply Wall St has no position in any stocks mentioned.
About SEHK:6855
Ascentage Pharma Group International
A clinical-stage biotechnology company, develops therapies for cancers, chronic hepatitis B virus (HBV), and age-related diseases in Mainland China.
Exceptional growth potential with adequate balance sheet.
Market Insights
Community Narratives


