
Advertisement
Beijing Tong Ren Tang Chinese Medicine Company Limited's (HKG:3613) Shares Climb 32% But Its Business Is Yet to Catch Up

Beijing Tong Ren Tang Chinese Medicine Company Limited (HKG:3613) shares have had a really impressive month, gaining 32% after a shaky period beforehand. Unfortunately, the gains of the last month did little to right the losses of the last year with the stock still down 24% over that time.
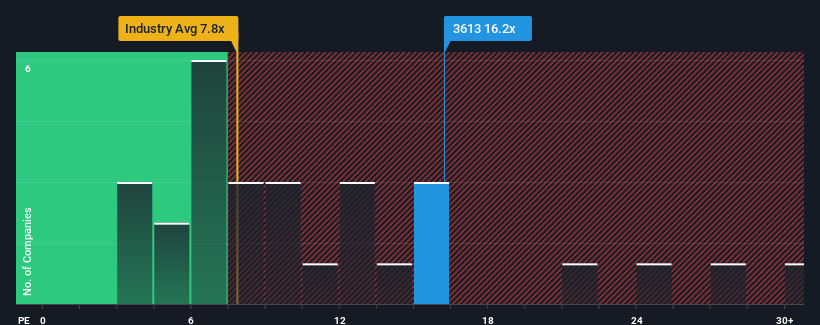
Following the firm bounce in price, Beijing Tong Ren Tang Chinese Medicine may be sending very bearish signals at the moment with a price-to-earnings (or "P/E") ratio of 16.2x, since almost half of all companies in Hong Kong have P/E ratios under 10x and even P/E's lower than 6x are not unusual. Nonetheless, we'd need to dig a little deeper to determine if there is a rational basis for the highly elevated P/E.
While the market has experienced earnings growth lately, Beijing Tong Ren Tang Chinese Medicine's earnings have gone into reverse gear, which is not great. One possibility is that the P/E is high because investors think this poor earnings performance will turn the corner. You'd really hope so, otherwise you're paying a pretty hefty price for no particular reason.
See our latest analysis for Beijing Tong Ren Tang Chinese Medicine
How Is Beijing Tong Ren Tang Chinese Medicine's Growth Trending?
There's an inherent assumption that a company should far outperform the market for P/E ratios like Beijing Tong Ren Tang Chinese Medicine's to be considered reasonable.
Taking a look back first, the company's earnings per share growth last year wasn't something to get excited about as it posted a disappointing decline of 29%. As a result, earnings from three years ago have also fallen 15% overall. Accordingly, shareholders would have felt downbeat about the medium-term rates of earnings growth.
Shifting to the future, estimates from the dual analysts covering the company suggest earnings should grow by 14% each year over the next three years. Meanwhile, the rest of the market is forecast to expand by 12% per year, which is not materially different.
In light of this, it's curious that Beijing Tong Ren Tang Chinese Medicine's P/E sits above the majority of other companies. Apparently many investors in the company are more bullish than analysts indicate and aren't willing to let go of their stock right now. These shareholders may be setting themselves up for disappointment if the P/E falls to levels more in line with the growth outlook.
What We Can Learn From Beijing Tong Ren Tang Chinese Medicine's P/E?
The strong share price surge has got Beijing Tong Ren Tang Chinese Medicine's P/E rushing to great heights as well. Typically, we'd caution against reading too much into price-to-earnings ratios when settling on investment decisions, though it can reveal plenty about what other market participants think about the company.
We've established that Beijing Tong Ren Tang Chinese Medicine currently trades on a higher than expected P/E since its forecast growth is only in line with the wider market. When we see an average earnings outlook with market-like growth, we suspect the share price is at risk of declining, sending the high P/E lower. This places shareholders' investments at risk and potential investors in danger of paying an unnecessary premium.
We don't want to rain on the parade too much, but we did also find 2 warning signs for Beijing Tong Ren Tang Chinese Medicine (1 is a bit concerning!) that you need to be mindful of.
If P/E ratios interest you, you may wish to see this free collection of other companies with strong earnings growth and low P/E ratios.
Valuation is complex, but we're here to simplify it.
Discover if Beijing Tong Ren Tang Chinese Medicine might be undervalued or overvalued with our detailed analysis, featuring fair value estimates, potential risks, dividends, insider trades, and its financial condition.
Access Free AnalysisHave feedback on this article? Concerned about the content? Get in touch with us directly. Alternatively, email editorial-team (at) simplywallst.com.
This article by Simply Wall St is general in nature. We provide commentary based on historical data and analyst forecasts only using an unbiased methodology and our articles are not intended to be financial advice. It does not constitute a recommendation to buy or sell any stock, and does not take account of your objectives, or your financial situation. We aim to bring you long-term focused analysis driven by fundamental data. Note that our analysis may not factor in the latest price-sensitive company announcements or qualitative material. Simply Wall St has no position in any stocks mentioned.
About SEHK:3613
Beijing Tong Ren Tang Chinese Medicine
Engages in the manufacture, retail, and wholesale of healthcare products and Chinese medicine to wholesalers and individuals.
Excellent balance sheet average dividend payer.
Market Insights

Advertisement
Community Narratives
Scaling up in building materials with smart M&A and growing profitability
Fair Value US$2.77|31.0% undervalued
CM
Community Contributor
Hims: The Platform Powering Personalised Healthcare
Fair Value US$114.01|53.1% undervalued
BL
Community Contributor
Undervalued lottery company with strong fundamentals
Fair Value AU$15.00|34.5% undervalued
RO
Community Contributor
Proximus, transferring money from the impatient to the patient investor
Fair Value €16.62|54.5% undervalued
AX
Community Contributor