China Shineway Pharmaceutical Group's (HKG:2877) 12% CAGR outpaced the company's earnings growth over the same five-year period


Stock pickers are generally looking for stocks that will outperform the broader market. And while active stock picking involves risks (and requires diversification) it can also provide excess returns. To wit, the China Shineway Pharmaceutical Group share price has climbed 23% in five years, easily topping the market decline of 5.0% (ignoring dividends). However, more recent returns haven't been as impressive as that, with the stock returning just 14% in the last year, including dividends.
After a strong gain in the past week, it's worth seeing if longer term returns have been driven by improving fundamentals.
See our latest analysis for China Shineway Pharmaceutical Group
While markets are a powerful pricing mechanism, share prices reflect investor sentiment, not just underlying business performance. One way to examine how market sentiment has changed over time is to look at the interaction between a company's share price and its earnings per share (EPS).
Over half a decade, China Shineway Pharmaceutical Group managed to grow its earnings per share at 17% a year. This EPS growth is higher than the 4% average annual increase in the share price. Therefore, it seems the market has become relatively pessimistic about the company. The reasonably low P/E ratio of 5.14 also suggests market apprehension.
You can see how EPS has changed over time in the image below (click on the chart to see the exact values).
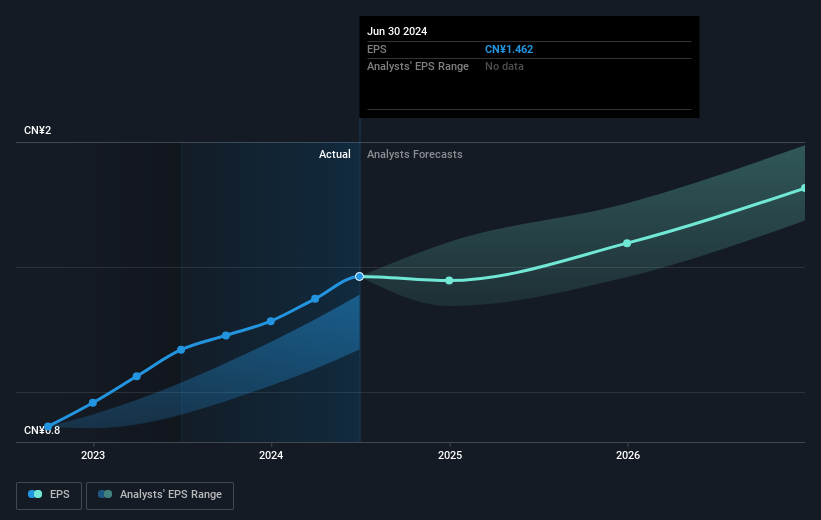
We know that China Shineway Pharmaceutical Group has improved its bottom line over the last three years, but what does the future have in store? If you are thinking of buying or selling China Shineway Pharmaceutical Group stock, you should check out this FREE detailed report on its balance sheet.
What About Dividends?
As well as measuring the share price return, investors should also consider the total shareholder return (TSR). The TSR is a return calculation that accounts for the value of cash dividends (assuming that any dividend received was reinvested) and the calculated value of any discounted capital raisings and spin-offs. So for companies that pay a generous dividend, the TSR is often a lot higher than the share price return. In the case of China Shineway Pharmaceutical Group, it has a TSR of 75% for the last 5 years. That exceeds its share price return that we previously mentioned. The dividends paid by the company have thusly boosted the total shareholder return.
A Different Perspective
China Shineway Pharmaceutical Group shareholders have received returns of 14% over twelve months (even including dividends), which isn't far from the general market return. That gain looks pretty satisfying, and it is even better than the five-year TSR of 12% per year. It is possible that management foresight will bring growth well into the future, even if the share price slows down. It's always interesting to track share price performance over the longer term. But to understand China Shineway Pharmaceutical Group better, we need to consider many other factors. For example, we've discovered 1 warning sign for China Shineway Pharmaceutical Group that you should be aware of before investing here.
If you are like me, then you will not want to miss this free list of undervalued small caps that insiders are buying.
Please note, the market returns quoted in this article reflect the market weighted average returns of stocks that currently trade on Hong Kong exchanges.
New: AI Stock Screener & Alerts
Our new AI Stock Screener scans the market every day to uncover opportunities.
• Dividend Powerhouses (3%+ Yield)
• Undervalued Small Caps with Insider Buying
• High growth Tech and AI Companies
Or build your own from over 50 metrics.
Have feedback on this article? Concerned about the content? Get in touch with us directly. Alternatively, email editorial-team (at) simplywallst.com.
This article by Simply Wall St is general in nature. We provide commentary based on historical data and analyst forecasts only using an unbiased methodology and our articles are not intended to be financial advice. It does not constitute a recommendation to buy or sell any stock, and does not take account of your objectives, or your financial situation. We aim to bring you long-term focused analysis driven by fundamental data. Note that our analysis may not factor in the latest price-sensitive company announcements or qualitative material. Simply Wall St has no position in any stocks mentioned.
About SEHK:2877
China Shineway Pharmaceutical Group
An investment holding company, engages in the research and development, manufacture, and trade of Chinese medicines in the People’s Republic of China and Hong Kong.
Undervalued with solid track record and pays a dividend.

