
Advertisement
Fusen Pharmaceutical Company Limited's (HKG:1652) Popularity With Investors Under Threat As Stock Sinks 27%

To the annoyance of some shareholders, Fusen Pharmaceutical Company Limited (HKG:1652) shares are down a considerable 27% in the last month, which continues a horrid run for the company. The drop over the last 30 days has capped off a tough year for shareholders, with the share price down 31% in that time.
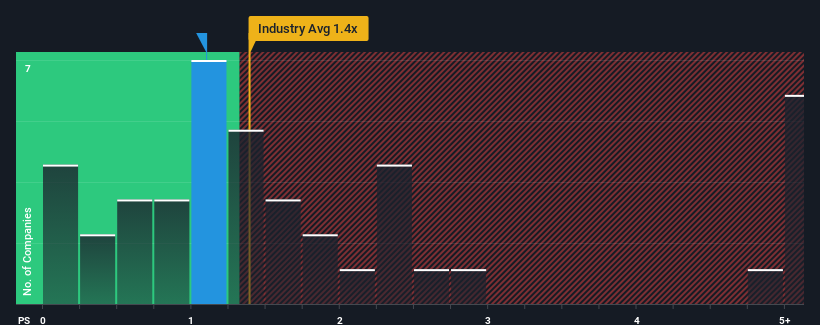
Although its price has dipped substantially, there still wouldn't be many who think Fusen Pharmaceutical's price-to-sales (or "P/S") ratio of 1.1x is worth a mention when the median P/S in Hong Kong's Pharmaceuticals industry is similar at about 1.4x. While this might not raise any eyebrows, if the P/S ratio is not justified investors could be missing out on a potential opportunity or ignoring looming disappointment.
View our latest analysis for Fusen Pharmaceutical
What Does Fusen Pharmaceutical's Recent Performance Look Like?
The revenue growth achieved at Fusen Pharmaceutical over the last year would be more than acceptable for most companies. It might be that many expect the respectable revenue performance to wane, which has kept the P/S from rising. If that doesn't eventuate, then existing shareholders probably aren't too pessimistic about the future direction of the share price.
We don't have analyst forecasts, but you can see how recent trends are setting up the company for the future by checking out our free report on Fusen Pharmaceutical's earnings, revenue and cash flow.Is There Some Revenue Growth Forecasted For Fusen Pharmaceutical?
In order to justify its P/S ratio, Fusen Pharmaceutical would need to produce growth that's similar to the industry.
Retrospectively, the last year delivered an exceptional 15% gain to the company's top line. Revenue has also lifted 16% in aggregate from three years ago, mostly thanks to the last 12 months of growth. Accordingly, shareholders would have probably been satisfied with the medium-term rates of revenue growth.
Comparing that to the industry, which is predicted to deliver 18% growth in the next 12 months, the company's momentum is weaker, based on recent medium-term annualised revenue results.
With this information, we find it interesting that Fusen Pharmaceutical is trading at a fairly similar P/S compared to the industry. Apparently many investors in the company are less bearish than recent times would indicate and aren't willing to let go of their stock right now. They may be setting themselves up for future disappointment if the P/S falls to levels more in line with recent growth rates.
What Does Fusen Pharmaceutical's P/S Mean For Investors?
Fusen Pharmaceutical's plummeting stock price has brought its P/S back to a similar region as the rest of the industry. While the price-to-sales ratio shouldn't be the defining factor in whether you buy a stock or not, it's quite a capable barometer of revenue expectations.
We've established that Fusen Pharmaceutical's average P/S is a bit surprising since its recent three-year growth is lower than the wider industry forecast. When we see weak revenue with slower than industry growth, we suspect the share price is at risk of declining, bringing the P/S back in line with expectations. Unless there is a significant improvement in the company's medium-term performance, it will be difficult to prevent the P/S ratio from declining to a more reasonable level.
Having said that, be aware Fusen Pharmaceutical is showing 3 warning signs in our investment analysis, and 2 of those are significant.
If companies with solid past earnings growth is up your alley, you may wish to see this free collection of other companies with strong earnings growth and low P/E ratios.
New: AI Stock Screener & Alerts
Our new AI Stock Screener scans the market every day to uncover opportunities.
• Dividend Powerhouses (3%+ Yield)
• Undervalued Small Caps with Insider Buying
• High growth Tech and AI Companies
Or build your own from over 50 metrics.
Have feedback on this article? Concerned about the content? Get in touch with us directly. Alternatively, email editorial-team (at) simplywallst.com.
This article by Simply Wall St is general in nature. We provide commentary based on historical data and analyst forecasts only using an unbiased methodology and our articles are not intended to be financial advice. It does not constitute a recommendation to buy or sell any stock, and does not take account of your objectives, or your financial situation. We aim to bring you long-term focused analysis driven by fundamental data. Note that our analysis may not factor in the latest price-sensitive company announcements or qualitative material. Simply Wall St has no position in any stocks mentioned.
About SEHK:1652
Fusen Pharmaceutical
An investment holding company, researches and develops, manufactures, and sells pharmaceutical products in the People’s Republic of China.
Slight and slightly overvalued.
Market Insights


Advertisement
Community Narratives
Nike's Direct-to-Consumer Focus Will Drive Future Growth
Fair Value US$87.90|18.2% undervalued
UN
Community Contributor
Novo Nordisk will dominate GLP-1 market with Ozempic and Wegovy growth
Fair Value US$89.59|12.1% undervalued
BE
Community Contributor
Rheinmetall could get 20-25% of EU-NATO 3%-GDP defence spending
Fair Value €7.57k|82.8% undervalued
NO
Community Contributor