- Hong Kong
- /
- Entertainment
- /
- SEHK:8368
Market Cool On Creative China Holdings Limited's (HKG:8368) Revenues Pushing Shares 28% Lower


Creative China Holdings Limited (HKG:8368) shares have had a horrible month, losing 28% after a relatively good period beforehand. The good news is that in the last year, the stock has shone bright like a diamond, gaining 233%.
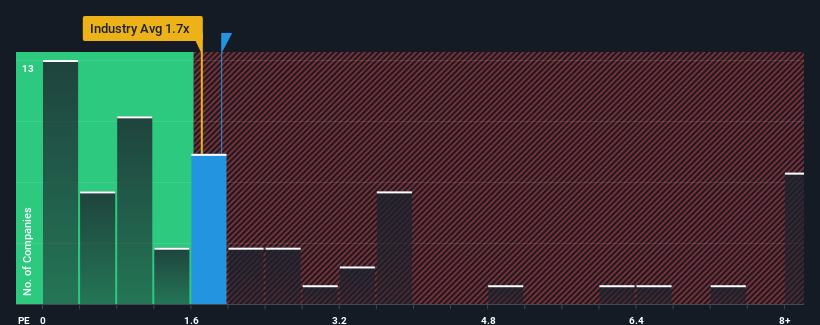
In spite of the heavy fall in price, you could still be forgiven for feeling indifferent about Creative China Holdings' P/S ratio of 1.9x, since the median price-to-sales (or "P/S") ratio for the Entertainment industry in Hong Kong is also close to 1.7x. Although, it's not wise to simply ignore the P/S without explanation as investors may be disregarding a distinct opportunity or a costly mistake.
See our latest analysis for Creative China Holdings
What Does Creative China Holdings' Recent Performance Look Like?
Recent times have been quite advantageous for Creative China Holdings as its revenue has been rising very briskly. It might be that many expect the strong revenue performance to wane, which has kept the share price, and thus the P/S ratio, from rising. If you like the company, you'd be hoping this isn't the case so that you could potentially pick up some stock while it's not quite in favour.
Want the full picture on earnings, revenue and cash flow for the company? Then our free report on Creative China Holdings will help you shine a light on its historical performance.What Are Revenue Growth Metrics Telling Us About The P/S?
The only time you'd be comfortable seeing a P/S like Creative China Holdings' is when the company's growth is tracking the industry closely.
If we review the last year of revenue growth, the company posted a terrific increase of 51%. Spectacularly, three year revenue growth has ballooned by several orders of magnitude, thanks in part to the last 12 months of revenue growth. So we can start by confirming that the company has done a tremendous job of growing revenue over that time.
When compared to the industry's one-year growth forecast of 46%, the most recent medium-term revenue trajectory is noticeably more alluring
In light of this, it's curious that Creative China Holdings' P/S sits in line with the majority of other companies. Apparently some shareholders believe the recent performance is at its limits and have been accepting lower selling prices.
The Key Takeaway
Following Creative China Holdings' share price tumble, its P/S is just clinging on to the industry median P/S. Using the price-to-sales ratio alone to determine if you should sell your stock isn't sensible, however it can be a practical guide to the company's future prospects.
We've established that Creative China Holdings currently trades on a lower than expected P/S since its recent three-year growth is higher than the wider industry forecast. It'd be fair to assume that potential risks the company faces could be the contributing factor to the lower than expected P/S. While recent revenue trends over the past medium-term suggest that the risk of a price decline is low, investors appear to see the likelihood of revenue fluctuations in the future.
You should always think about risks. Case in point, we've spotted 5 warning signs for Creative China Holdings you should be aware of, and 1 of them is concerning.
If companies with solid past earnings growth is up your alley, you may wish to see this free collection of other companies with strong earnings growth and low P/E ratios.
New: AI Stock Screener & Alerts
Our new AI Stock Screener scans the market every day to uncover opportunities.
• Dividend Powerhouses (3%+ Yield)
• Undervalued Small Caps with Insider Buying
• High growth Tech and AI Companies
Or build your own from over 50 metrics.
Have feedback on this article? Concerned about the content? Get in touch with us directly. Alternatively, email editorial-team (at) simplywallst.com.
This article by Simply Wall St is general in nature. We provide commentary based on historical data and analyst forecasts only using an unbiased methodology and our articles are not intended to be financial advice. It does not constitute a recommendation to buy or sell any stock, and does not take account of your objectives, or your financial situation. We aim to bring you long-term focused analysis driven by fundamental data. Note that our analysis may not factor in the latest price-sensitive company announcements or qualitative material. Simply Wall St has no position in any stocks mentioned.
About SEHK:8368
Creative China Holdings
An investment holding company, primarily provides film and television program original script creation, adaptation, production and licensing, and related services in the People’s Republic of China, Hong Kong, and Southeast Asia.
Excellent balance sheet low.

