
Advertisement
- Hong Kong
- /
- Metals and Mining
- /
- SEHK:6890
KangLi International Holdings Limited (HKG:6890) Shares May Have Slumped 26% But Getting In Cheap Is Still Unlikely

The KangLi International Holdings Limited (HKG:6890) share price has fared very poorly over the last month, falling by a substantial 26%. The drop over the last 30 days has capped off a tough year for shareholders, with the share price down 21% in that time.
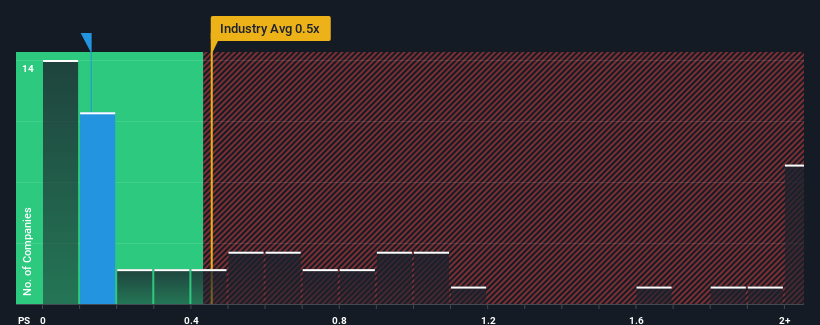
In spite of the heavy fall in price, you could still be forgiven for feeling indifferent about KangLi International Holdings' P/S ratio of 0.1x, since the median price-to-sales (or "P/S") ratio for the Metals and Mining industry in Hong Kong is also close to 0.5x. Although, it's not wise to simply ignore the P/S without explanation as investors may be disregarding a distinct opportunity or a costly mistake.
Check out our latest analysis for KangLi International Holdings
How KangLi International Holdings Has Been Performing
As an illustration, revenue has deteriorated at KangLi International Holdings over the last year, which is not ideal at all. One possibility is that the P/S is moderate because investors think the company might still do enough to be in line with the broader industry in the near future. If you like the company, you'd at least be hoping this is the case so that you could potentially pick up some stock while it's not quite in favour.
We don't have analyst forecasts, but you can see how recent trends are setting up the company for the future by checking out our free report on KangLi International Holdings' earnings, revenue and cash flow.What Are Revenue Growth Metrics Telling Us About The P/S?
There's an inherent assumption that a company should be matching the industry for P/S ratios like KangLi International Holdings' to be considered reasonable.
Retrospectively, the last year delivered a frustrating 14% decrease to the company's top line. This has soured the latest three-year period, which nevertheless managed to deliver a decent 9.3% overall rise in revenue. Although it's been a bumpy ride, it's still fair to say the revenue growth recently has been mostly respectable for the company.
Comparing the recent medium-term revenue trends against the industry's one-year growth forecast of 9.5% shows it's noticeably less attractive.
In light of this, it's curious that KangLi International Holdings' P/S sits in line with the majority of other companies. Apparently many investors in the company are less bearish than recent times would indicate and aren't willing to let go of their stock right now. They may be setting themselves up for future disappointment if the P/S falls to levels more in line with recent growth rates.
The Bottom Line On KangLi International Holdings' P/S
With its share price dropping off a cliff, the P/S for KangLi International Holdings looks to be in line with the rest of the Metals and Mining industry. It's argued the price-to-sales ratio is an inferior measure of value within certain industries, but it can be a powerful business sentiment indicator.
Our examination of KangLi International Holdings revealed its poor three-year revenue trends aren't resulting in a lower P/S as per our expectations, given they look worse than current industry outlook. When we see weak revenue with slower than industry growth, we suspect the share price is at risk of declining, bringing the P/S back in line with expectations. Unless the recent medium-term conditions improve, it's hard to accept the current share price as fair value.
You should always think about risks. Case in point, we've spotted 2 warning signs for KangLi International Holdings you should be aware of, and 1 of them is concerning.
If strong companies turning a profit tickle your fancy, then you'll want to check out this free list of interesting companies that trade on a low P/E (but have proven they can grow earnings).
Valuation is complex, but we're here to simplify it.
Discover if KangLi International Holdings might be undervalued or overvalued with our detailed analysis, featuring fair value estimates, potential risks, dividends, insider trades, and its financial condition.
Access Free AnalysisHave feedback on this article? Concerned about the content? Get in touch with us directly. Alternatively, email editorial-team (at) simplywallst.com.
This article by Simply Wall St is general in nature. We provide commentary based on historical data and analyst forecasts only using an unbiased methodology and our articles are not intended to be financial advice. It does not constitute a recommendation to buy or sell any stock, and does not take account of your objectives, or your financial situation. We aim to bring you long-term focused analysis driven by fundamental data. Note that our analysis may not factor in the latest price-sensitive company announcements or qualitative material. Simply Wall St has no position in any stocks mentioned.
About SEHK:6890
KangLi International Holdings
Engages in the manufacture and sale of steel products in the People’s Republic of China and Thailand.
Flawless balance sheet and good value.
Market Insights

Advertisement
Community Narratives
Scaling up in building materials with smart M&A and growing profitability
Fair Value US$2.77|30.0% undervalued
CM
Community Contributor
Hims: The Platform Powering Personalised Healthcare
Fair Value US$114.01|51.9% undervalued
BL
Community Contributor
Undervalued lottery company with strong fundamentals
Fair Value AU$15.00|34.5% undervalued
RO
Community Contributor
Proximus, transferring money from the impatient to the patient investor
Fair Value €16.62|55.1% undervalued
AX
Community Contributor