- Hong Kong
- /
- Metals and Mining
- /
- SEHK:340
Subdued Growth No Barrier To Tongguan Gold Group Limited (HKG:340) With Shares Advancing 30%


Tongguan Gold Group Limited (HKG:340) shareholders have had their patience rewarded with a 30% share price jump in the last month. The last 30 days bring the annual gain to a very sharp 50%.
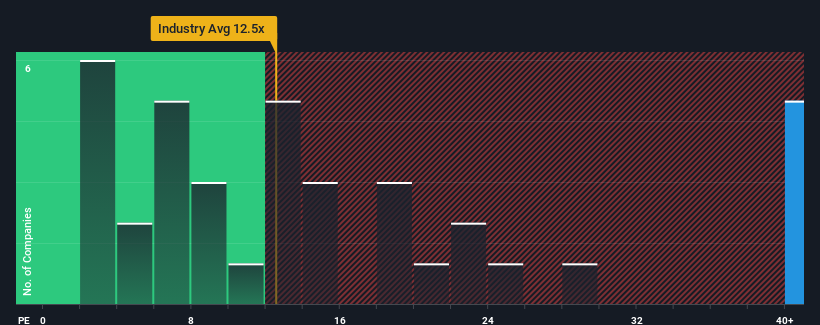
After such a large jump in price, Tongguan Gold Group's price-to-earnings (or "P/E") ratio of 45.1x might make it look like a strong sell right now compared to the market in Hong Kong, where around half of the companies have P/E ratios below 9x and even P/E's below 5x are quite common. Nonetheless, we'd need to dig a little deeper to determine if there is a rational basis for the highly elevated P/E.
As an illustration, earnings have deteriorated at Tongguan Gold Group over the last year, which is not ideal at all. One possibility is that the P/E is high because investors think the company will still do enough to outperform the broader market in the near future. If not, then existing shareholders may be quite nervous about the viability of the share price.
Check out our latest analysis for Tongguan Gold Group
Does Growth Match The High P/E?
There's an inherent assumption that a company should far outperform the market for P/E ratios like Tongguan Gold Group's to be considered reasonable.
Retrospectively, the last year delivered a frustrating 6.2% decrease to the company's bottom line. This has erased any of its gains during the last three years, with practically no change in EPS being achieved in total. So it appears to us that the company has had a mixed result in terms of growing earnings over that time.
Weighing that recent medium-term earnings trajectory against the broader market's one-year forecast for expansion of 21% shows it's noticeably less attractive on an annualised basis.
In light of this, it's alarming that Tongguan Gold Group's P/E sits above the majority of other companies. Apparently many investors in the company are way more bullish than recent times would indicate and aren't willing to let go of their stock at any price. There's a good chance existing shareholders are setting themselves up for future disappointment if the P/E falls to levels more in line with recent growth rates.
The Final Word
The strong share price surge has got Tongguan Gold Group's P/E rushing to great heights as well. Generally, our preference is to limit the use of the price-to-earnings ratio to establishing what the market thinks about the overall health of a company.
We've established that Tongguan Gold Group currently trades on a much higher than expected P/E since its recent three-year growth is lower than the wider market forecast. Right now we are increasingly uncomfortable with the high P/E as this earnings performance isn't likely to support such positive sentiment for long. If recent medium-term earnings trends continue, it will place shareholders' investments at significant risk and potential investors in danger of paying an excessive premium.
And what about other risks? Every company has them, and we've spotted 2 warning signs for Tongguan Gold Group you should know about.
Of course, you might find a fantastic investment by looking at a few good candidates. So take a peek at this free list of companies with a strong growth track record, trading on a low P/E.
Valuation is complex, but we're here to simplify it.
Discover if Tongguan Gold Group might be undervalued or overvalued with our detailed analysis, featuring fair value estimates, potential risks, dividends, insider trades, and its financial condition.
Access Free AnalysisHave feedback on this article? Concerned about the content? Get in touch with us directly. Alternatively, email editorial-team (at) simplywallst.com.
This article by Simply Wall St is general in nature. We provide commentary based on historical data and analyst forecasts only using an unbiased methodology and our articles are not intended to be financial advice. It does not constitute a recommendation to buy or sell any stock, and does not take account of your objectives, or your financial situation. We aim to bring you long-term focused analysis driven by fundamental data. Note that our analysis may not factor in the latest price-sensitive company announcements or qualitative material. Simply Wall St has no position in any stocks mentioned.
About SEHK:340
Tongguan Gold Group
An investment holding company, engages in the exploration, mining, processing, and sale of gold and related products in the People's Republic of China.
Solid track record with mediocre balance sheet.
