SANVO Fine Chemicals Group Limited's (HKG:301) 44% Share Price Surge Not Quite Adding Up


SANVO Fine Chemicals Group Limited (HKG:301) shares have had a really impressive month, gaining 44% after a shaky period beforehand. Unfortunately, the gains of the last month did little to right the losses of the last year with the stock still down 12% over that time.
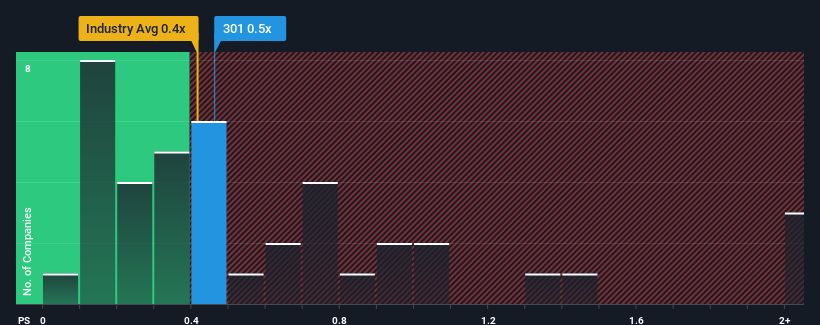
Even after such a large jump in price, there still wouldn't be many who think SANVO Fine Chemicals Group's price-to-sales (or "P/S") ratio of 0.5x is worth a mention when the median P/S in Hong Kong's Chemicals industry is similar at about 0.4x. However, investors might be overlooking a clear opportunity or potential setback if there is no rational basis for the P/S.
Check out our latest analysis for SANVO Fine Chemicals Group
What Does SANVO Fine Chemicals Group's P/S Mean For Shareholders?
Revenue has risen at a steady rate over the last year for SANVO Fine Chemicals Group, which is generally not a bad outcome. One possibility is that the P/S is moderate because investors think this good revenue growth might only be parallel to the broader industry in the near future. If not, then at least existing shareholders probably aren't too pessimistic about the future direction of the share price.
Want the full picture on earnings, revenue and cash flow for the company? Then our free report on SANVO Fine Chemicals Group will help you shine a light on its historical performance.What Are Revenue Growth Metrics Telling Us About The P/S?
The only time you'd be comfortable seeing a P/S like SANVO Fine Chemicals Group's is when the company's growth is tracking the industry closely.
If we review the last year of revenue growth, the company posted a worthy increase of 5.7%. Revenue has also lifted 11% in aggregate from three years ago, partly thanks to the last 12 months of growth. Therefore, it's fair to say the revenue growth recently has been respectable for the company.
Comparing that to the industry, which is predicted to deliver 5.6% growth in the next 12 months, the company's momentum is weaker, based on recent medium-term annualised revenue results.
In light of this, it's curious that SANVO Fine Chemicals Group's P/S sits in line with the majority of other companies. Apparently many investors in the company are less bearish than recent times would indicate and aren't willing to let go of their stock right now. They may be setting themselves up for future disappointment if the P/S falls to levels more in line with recent growth rates.
What We Can Learn From SANVO Fine Chemicals Group's P/S?
SANVO Fine Chemicals Group appears to be back in favour with a solid price jump bringing its P/S back in line with other companies in the industry It's argued the price-to-sales ratio is an inferior measure of value within certain industries, but it can be a powerful business sentiment indicator.
We've established that SANVO Fine Chemicals Group's average P/S is a bit surprising since its recent three-year growth is lower than the wider industry forecast. When we see weak revenue with slower than industry growth, we suspect the share price is at risk of declining, bringing the P/S back in line with expectations. Unless the recent medium-term conditions improve, it's hard to accept the current share price as fair value.
And what about other risks? Every company has them, and we've spotted 4 warning signs for SANVO Fine Chemicals Group (of which 1 is concerning!) you should know about.
If strong companies turning a profit tickle your fancy, then you'll want to check out this free list of interesting companies that trade on a low P/E (but have proven they can grow earnings).
If you're looking to trade SANVO Fine Chemicals Group, open an account with the lowest-cost platform trusted by professionals, Interactive Brokers.
With clients in over 200 countries and territories, and access to 160 markets, IBKR lets you trade stocks, options, futures, forex, bonds and funds from a single integrated account.
Enjoy no hidden fees, no account minimums, and FX conversion rates as low as 0.03%, far better than what most brokers offer.
Sponsored ContentNew: Manage All Your Stock Portfolios in One Place
We've created the ultimate portfolio companion for stock investors, and it's free.
• Connect an unlimited number of Portfolios and see your total in one currency
• Be alerted to new Warning Signs or Risks via email or mobile
• Track the Fair Value of your stocks
Have feedback on this article? Concerned about the content? Get in touch with us directly. Alternatively, email editorial-team (at) simplywallst.com.
This article by Simply Wall St is general in nature. We provide commentary based on historical data and analyst forecasts only using an unbiased methodology and our articles are not intended to be financial advice. It does not constitute a recommendation to buy or sell any stock, and does not take account of your objectives, or your financial situation. We aim to bring you long-term focused analysis driven by fundamental data. Note that our analysis may not factor in the latest price-sensitive company announcements or qualitative material. Simply Wall St has no position in any stocks mentioned.
About SEHK:301
SANVO Fine Chemicals Group
An investment holding company, engages in the research and development, manufacture, and sale of fine industrial chemical products in the People's Republic of China, Australia, and internationally.
Moderate with mediocre balance sheet.
Market Insights

Community Narratives


