- Hong Kong
- /
- Metals and Mining
- /
- SEHK:2738
Investors Give Huajin International Holdings Limited (HKG:2738) Shares A 31% Hiding


Huajin International Holdings Limited (HKG:2738) shares have had a horrible month, losing 31% after a relatively good period beforehand. Looking back over the past twelve months the stock has been a solid performer regardless, with a gain of 20%.
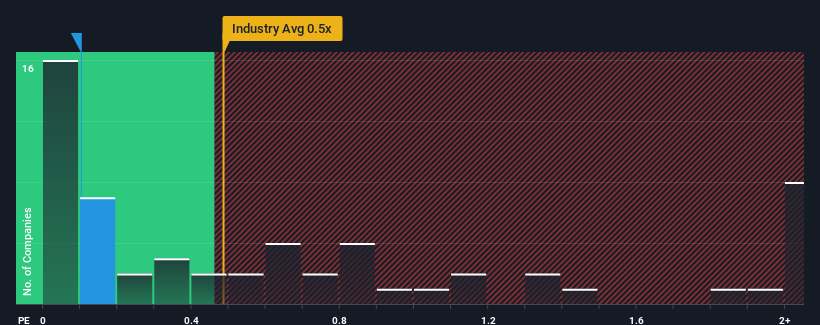
Although its price has dipped substantially, it's still not a stretch to say that Huajin International Holdings' price-to-sales (or "P/S") ratio of 0.1x right now seems quite "middle-of-the-road" compared to the Metals and Mining industry in Hong Kong, where the median P/S ratio is around 0.5x. Although, it's not wise to simply ignore the P/S without explanation as investors may be disregarding a distinct opportunity or a costly mistake.
Check out our latest analysis for Huajin International Holdings
What Does Huajin International Holdings' P/S Mean For Shareholders?
Huajin International Holdings certainly has been doing a great job lately as it's been growing its revenue at a really rapid pace. Perhaps the market is expecting future revenue performance to taper off, which has kept the P/S from rising. Those who are bullish on Huajin International Holdings will be hoping that this isn't the case, so that they can pick up the stock at a lower valuation.
We don't have analyst forecasts, but you can see how recent trends are setting up the company for the future by checking out our free report on Huajin International Holdings' earnings, revenue and cash flow.Do Revenue Forecasts Match The P/S Ratio?
There's an inherent assumption that a company should be matching the industry for P/S ratios like Huajin International Holdings' to be considered reasonable.
Retrospectively, the last year delivered an exceptional 41% gain to the company's top line. Pleasingly, revenue has also lifted 131% in aggregate from three years ago, thanks to the last 12 months of growth. Accordingly, shareholders would have definitely welcomed those medium-term rates of revenue growth.
When compared to the industry's one-year growth forecast of 9.8%, the most recent medium-term revenue trajectory is noticeably more alluring
With this information, we find it interesting that Huajin International Holdings is trading at a fairly similar P/S compared to the industry. Apparently some shareholders believe the recent performance is at its limits and have been accepting lower selling prices.
The Bottom Line On Huajin International Holdings' P/S
Following Huajin International Holdings' share price tumble, its P/S is just clinging on to the industry median P/S. Using the price-to-sales ratio alone to determine if you should sell your stock isn't sensible, however it can be a practical guide to the company's future prospects.
We didn't quite envision Huajin International Holdings' P/S sitting in line with the wider industry, considering the revenue growth over the last three-year is higher than the current industry outlook. It'd be fair to assume that potential risks the company faces could be the contributing factor to the lower than expected P/S. At least the risk of a price drop looks to be subdued if recent medium-term revenue trends continue, but investors seem to think future revenue could see some volatility.
There are also other vital risk factors to consider and we've discovered 4 warning signs for Huajin International Holdings (2 are concerning!) that you should be aware of before investing here.
If companies with solid past earnings growth is up your alley, you may wish to see this free collection of other companies with strong earnings growth and low P/E ratios.
If you're looking to trade Huajin International Holdings, open an account with the lowest-cost platform trusted by professionals, Interactive Brokers.
With clients in over 200 countries and territories, and access to 160 markets, IBKR lets you trade stocks, options, futures, forex, bonds and funds from a single integrated account.
Enjoy no hidden fees, no account minimums, and FX conversion rates as low as 0.03%, far better than what most brokers offer.
Sponsored ContentValuation is complex, but we're here to simplify it.
Discover if Huajin International Holdings might be undervalued or overvalued with our detailed analysis, featuring fair value estimates, potential risks, dividends, insider trades, and its financial condition.
Access Free AnalysisHave feedback on this article? Concerned about the content? Get in touch with us directly. Alternatively, email editorial-team (at) simplywallst.com.
This article by Simply Wall St is general in nature. We provide commentary based on historical data and analyst forecasts only using an unbiased methodology and our articles are not intended to be financial advice. It does not constitute a recommendation to buy or sell any stock, and does not take account of your objectives, or your financial situation. We aim to bring you long-term focused analysis driven by fundamental data. Note that our analysis may not factor in the latest price-sensitive company announcements or qualitative material. Simply Wall St has no position in any stocks mentioned.
About SEHK:2738
Huajin International Holdings
An investment holding company, engages in the processing and sale of cold-rolled and galvanized steel products in the People’s Republic of China, Hong Kong, and Southeast Asia.
Slight and slightly overvalued.
Market Insights

Community Narratives


