
Advertisement
- Hong Kong
- /
- Electronic Equipment and Components
- /
- SEHK:1335
Further Upside For Sheen Tai Holdings Group Company Limited (HKG:1335) Shares Could Introduce Price Risks After 59% Bounce

Sheen Tai Holdings Group Company Limited (HKG:1335) shareholders would be excited to see that the share price has had a great month, posting a 59% gain and recovering from prior weakness. Not all shareholders will be feeling jubilant, since the share price is still down a very disappointing 16% in the last twelve months.
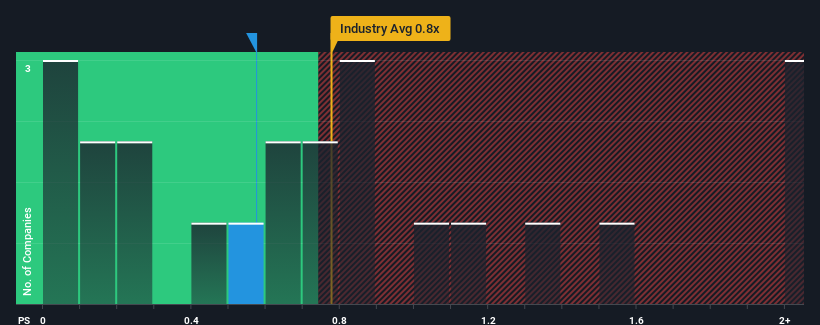
In spite of the firm bounce in price, there still wouldn't be many who think Sheen Tai Holdings Group's price-to-sales (or "P/S") ratio of 0.6x is worth a mention when the median P/S in Hong Kong's Packaging industry is similar at about 0.8x. While this might not raise any eyebrows, if the P/S ratio is not justified investors could be missing out on a potential opportunity or ignoring looming disappointment.
View our latest analysis for Sheen Tai Holdings Group
What Does Sheen Tai Holdings Group's Recent Performance Look Like?
Sheen Tai Holdings Group certainly has been doing a great job lately as it's been growing its revenue at a really rapid pace. It might be that many expect the strong revenue performance to wane, which has kept the share price, and thus the P/S ratio, from rising. If you like the company, you'd be hoping this isn't the case so that you could potentially pick up some stock while it's not quite in favour.
Want the full picture on earnings, revenue and cash flow for the company? Then our free report on Sheen Tai Holdings Group will help you shine a light on its historical performance.Do Revenue Forecasts Match The P/S Ratio?
Sheen Tai Holdings Group's P/S ratio would be typical for a company that's only expected to deliver moderate growth, and importantly, perform in line with the industry.
If we review the last year of revenue growth, the company posted a terrific increase of 34%. The latest three year period has also seen an incredible overall rise in revenue, aided by its incredible short-term performance. So we can start by confirming that the company has done a tremendous job of growing revenue over that time.
Comparing that to the industry, which is only predicted to deliver 20% growth in the next 12 months, the company's momentum is stronger based on recent medium-term annualised revenue results.
With this information, we find it interesting that Sheen Tai Holdings Group is trading at a fairly similar P/S compared to the industry. Apparently some shareholders believe the recent performance is at its limits and have been accepting lower selling prices.
What Does Sheen Tai Holdings Group's P/S Mean For Investors?
Sheen Tai Holdings Group's stock has a lot of momentum behind it lately, which has brought its P/S level with the rest of the industry. It's argued the price-to-sales ratio is an inferior measure of value within certain industries, but it can be a powerful business sentiment indicator.
We've established that Sheen Tai Holdings Group currently trades on a lower than expected P/S since its recent three-year growth is higher than the wider industry forecast. It'd be fair to assume that potential risks the company faces could be the contributing factor to the lower than expected P/S. While recent revenue trends over the past medium-term suggest that the risk of a price decline is low, investors appear to see the likelihood of revenue fluctuations in the future.
And what about other risks? Every company has them, and we've spotted 3 warning signs for Sheen Tai Holdings Group (of which 1 shouldn't be ignored!) you should know about.
Of course, profitable companies with a history of great earnings growth are generally safer bets. So you may wish to see this free collection of other companies that have reasonable P/E ratios and have grown earnings strongly.
New: Manage All Your Stock Portfolios in One Place
We've created the ultimate portfolio companion for stock investors, and it's free.
• Connect an unlimited number of Portfolios and see your total in one currency
• Be alerted to new Warning Signs or Risks via email or mobile
• Track the Fair Value of your stocks
Have feedback on this article? Concerned about the content? Get in touch with us directly. Alternatively, email editorial-team (at) simplywallst.com.
This article by Simply Wall St is general in nature. We provide commentary based on historical data and analyst forecasts only using an unbiased methodology and our articles are not intended to be financial advice. It does not constitute a recommendation to buy or sell any stock, and does not take account of your objectives, or your financial situation. We aim to bring you long-term focused analysis driven by fundamental data. Note that our analysis may not factor in the latest price-sensitive company announcements or qualitative material. Simply Wall St has no position in any stocks mentioned.
About SEHK:1335
Sheen Tai Holdings Group
An investment holding company, engages in the trading of semi-conductors in Hong Kong and Mainland China.
Flawless balance sheet low.
Market Insights

Advertisement
Community Narratives
Pinterest will surge as advertising innovations ignite revenue growth
Fair Value US$42.63|26.3% undervalued
BR
Community Contributor
Brambles' Revenue Set to Climb 14% with Profit Margins Following
Fair Value AU$21.90|4.8% overvalued
RO
Community Contributor
Challenging Future for STG as Organic Sales Decline by 8.8%
Fair Value DKK 116.13|26.8% undervalued
KA
Community Contributor