- Hong Kong
- /
- Household Products
- /
- SEHK:3331
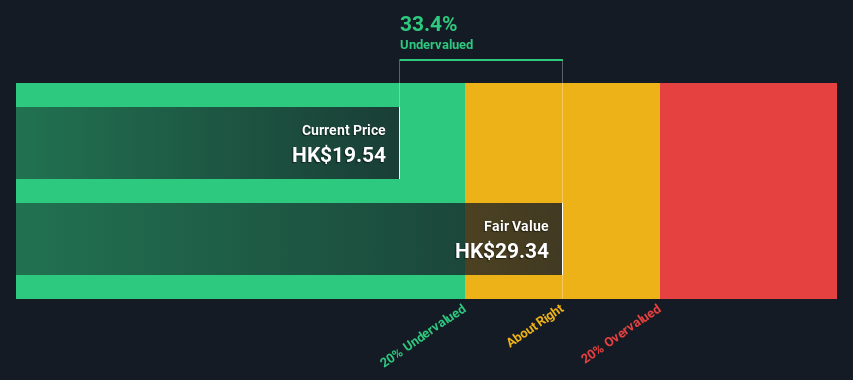
Are Investors Undervaluing Vinda International Holdings Limited (HKG:3331) By 33%?


Key Insights
- Vinda International Holdings' estimated fair value is HK$29.34 based on 2 Stage Free Cash Flow to Equity
- Current share price of HK$19.54 suggests Vinda International Holdings is potentially 33% undervalued
- The HK$20.19 analyst price target for 3331 is 31% less than our estimate of fair value
How far off is Vinda International Holdings Limited (HKG:3331) from its intrinsic value? Using the most recent financial data, we'll take a look at whether the stock is fairly priced by taking the expected future cash flows and discounting them to their present value. One way to achieve this is by employing the Discounted Cash Flow (DCF) model. Models like these may appear beyond the comprehension of a lay person, but they're fairly easy to follow.
We would caution that there are many ways of valuing a company and, like the DCF, each technique has advantages and disadvantages in certain scenarios. For those who are keen learners of equity analysis, the Simply Wall St analysis model here may be something of interest to you.
See our latest analysis for Vinda International Holdings
Step By Step Through The Calculation
We use what is known as a 2-stage model, which simply means we have two different periods of growth rates for the company's cash flows. Generally the first stage is higher growth, and the second stage is a lower growth phase. To begin with, we have to get estimates of the next ten years of cash flows. Where possible we use analyst estimates, but when these aren't available we extrapolate the previous free cash flow (FCF) from the last estimate or reported value. We assume companies with shrinking free cash flow will slow their rate of shrinkage, and that companies with growing free cash flow will see their growth rate slow, over this period. We do this to reflect that growth tends to slow more in the early years than it does in later years.
A DCF is all about the idea that a dollar in the future is less valuable than a dollar today, so we need to discount the sum of these future cash flows to arrive at a present value estimate:
10-year free cash flow (FCF) estimate
| 2024 | 2025 | 2026 | 2027 | 2028 | 2029 | 2030 | 2031 | 2032 | 2033 | |
| Levered FCF (HK$, Millions) | HK$1.42b | HK$1.54b | HK$1.63b | HK$1.71b | HK$1.78b | HK$1.83b | HK$1.89b | HK$1.94b | HK$1.99b | HK$2.03b |
| Growth Rate Estimate Source | Analyst x3 | Analyst x3 | Est @ 5.88% | Est @ 4.71% | Est @ 3.89% | Est @ 3.31% | Est @ 2.91% | Est @ 2.63% | Est @ 2.43% | Est @ 2.29% |
| Present Value (HK$, Millions) Discounted @ 6.7% | HK$1.3k | HK$1.4k | HK$1.3k | HK$1.3k | HK$1.3k | HK$1.2k | HK$1.2k | HK$1.2k | HK$1.1k | HK$1.1k |
("Est" = FCF growth rate estimated by Simply Wall St)
Present Value of 10-year Cash Flow (PVCF) = HK$12b
The second stage is also known as Terminal Value, this is the business's cash flow after the first stage. The Gordon Growth formula is used to calculate Terminal Value at a future annual growth rate equal to the 5-year average of the 10-year government bond yield of 2.0%. We discount the terminal cash flows to today's value at a cost of equity of 6.7%.
Terminal Value (TV)= FCF2033 × (1 + g) ÷ (r – g) = HK$2.0b× (1 + 2.0%) ÷ (6.7%– 2.0%) = HK$44b
Present Value of Terminal Value (PVTV)= TV / (1 + r)10= HK$44b÷ ( 1 + 6.7%)10= HK$23b
The total value, or equity value, is then the sum of the present value of the future cash flows, which in this case is HK$35b. In the final step we divide the equity value by the number of shares outstanding. Relative to the current share price of HK$19.5, the company appears quite undervalued at a 33% discount to where the stock price trades currently. Valuations are imprecise instruments though, rather like a telescope - move a few degrees and end up in a different galaxy. Do keep this in mind.
Important Assumptions
We would point out that the most important inputs to a discounted cash flow are the discount rate and of course the actual cash flows. If you don't agree with these result, have a go at the calculation yourself and play with the assumptions. The DCF also does not consider the possible cyclicality of an industry, or a company's future capital requirements, so it does not give a full picture of a company's potential performance. Given that we are looking at Vinda International Holdings as potential shareholders, the cost of equity is used as the discount rate, rather than the cost of capital (or weighted average cost of capital, WACC) which accounts for debt. In this calculation we've used 6.7%, which is based on a levered beta of 0.800. Beta is a measure of a stock's volatility, compared to the market as a whole. We get our beta from the industry average beta of globally comparable companies, with an imposed limit between 0.8 and 2.0, which is a reasonable range for a stable business.
SWOT Analysis for Vinda International Holdings
- Debt is well covered by .
- Earnings declined over the past year.
- Interest payments on debt are not well covered.
- Dividend is low compared to the top 25% of dividend payers in the Household Products market.
- Annual earnings are forecast to grow faster than the Hong Kong market.
- Trading below our estimate of fair value by more than 20%.
- Significant insider buying over the past 3 months.
- Debt is not well covered by operating cash flow.
- Dividends are not covered by earnings.
- Annual revenue is forecast to grow slower than the Hong Kong market.
Looking Ahead:
Valuation is only one side of the coin in terms of building your investment thesis, and it is only one of many factors that you need to assess for a company. DCF models are not the be-all and end-all of investment valuation. Rather it should be seen as a guide to "what assumptions need to be true for this stock to be under/overvalued?" For instance, if the terminal value growth rate is adjusted slightly, it can dramatically alter the overall result. Why is the intrinsic value higher than the current share price? For Vinda International Holdings, we've put together three further aspects you should explore:
- Risks: Take risks, for example - Vinda International Holdings has 2 warning signs (and 1 which is a bit concerning) we think you should know about.
- Future Earnings: How does 3331's growth rate compare to its peers and the wider market? Dig deeper into the analyst consensus number for the upcoming years by interacting with our free analyst growth expectation chart.
- Other Solid Businesses: Low debt, high returns on equity and good past performance are fundamental to a strong business. Why not explore our interactive list of stocks with solid business fundamentals to see if there are other companies you may not have considered!
PS. The Simply Wall St app conducts a discounted cash flow valuation for every stock on the SEHK every day. If you want to find the calculation for other stocks just search here.
If you're looking to trade Vinda International Holdings, open an account with the lowest-cost platform trusted by professionals, Interactive Brokers.
With clients in over 200 countries and territories, and access to 160 markets, IBKR lets you trade stocks, options, futures, forex, bonds and funds from a single integrated account.
Enjoy no hidden fees, no account minimums, and FX conversion rates as low as 0.03%, far better than what most brokers offer.
Sponsored ContentNew: Manage All Your Stock Portfolios in One Place
We've created the ultimate portfolio companion for stock investors, and it's free.
• Connect an unlimited number of Portfolios and see your total in one currency
• Be alerted to new Warning Signs or Risks via email or mobile
• Track the Fair Value of your stocks
Have feedback on this article? Concerned about the content? Get in touch with us directly. Alternatively, email editorial-team (at) simplywallst.com.
This article by Simply Wall St is general in nature. We provide commentary based on historical data and analyst forecasts only using an unbiased methodology and our articles are not intended to be financial advice. It does not constitute a recommendation to buy or sell any stock, and does not take account of your objectives, or your financial situation. We aim to bring you long-term focused analysis driven by fundamental data. Note that our analysis may not factor in the latest price-sensitive company announcements or qualitative material. Simply Wall St has no position in any stocks mentioned.
About SEHK:3331
Vinda International Holdings
Vinda International Holdings Limited, an investment holding company, manufactures and sells household paper and personal care products in Mainland China, Hong Kong, Malaysia, Japan, Taiwan, and internationally.
Flawless balance sheet with moderate growth potential.
Market Insights

Community Narratives


